United Kingdom bought 17.8% of Norway's goods exports
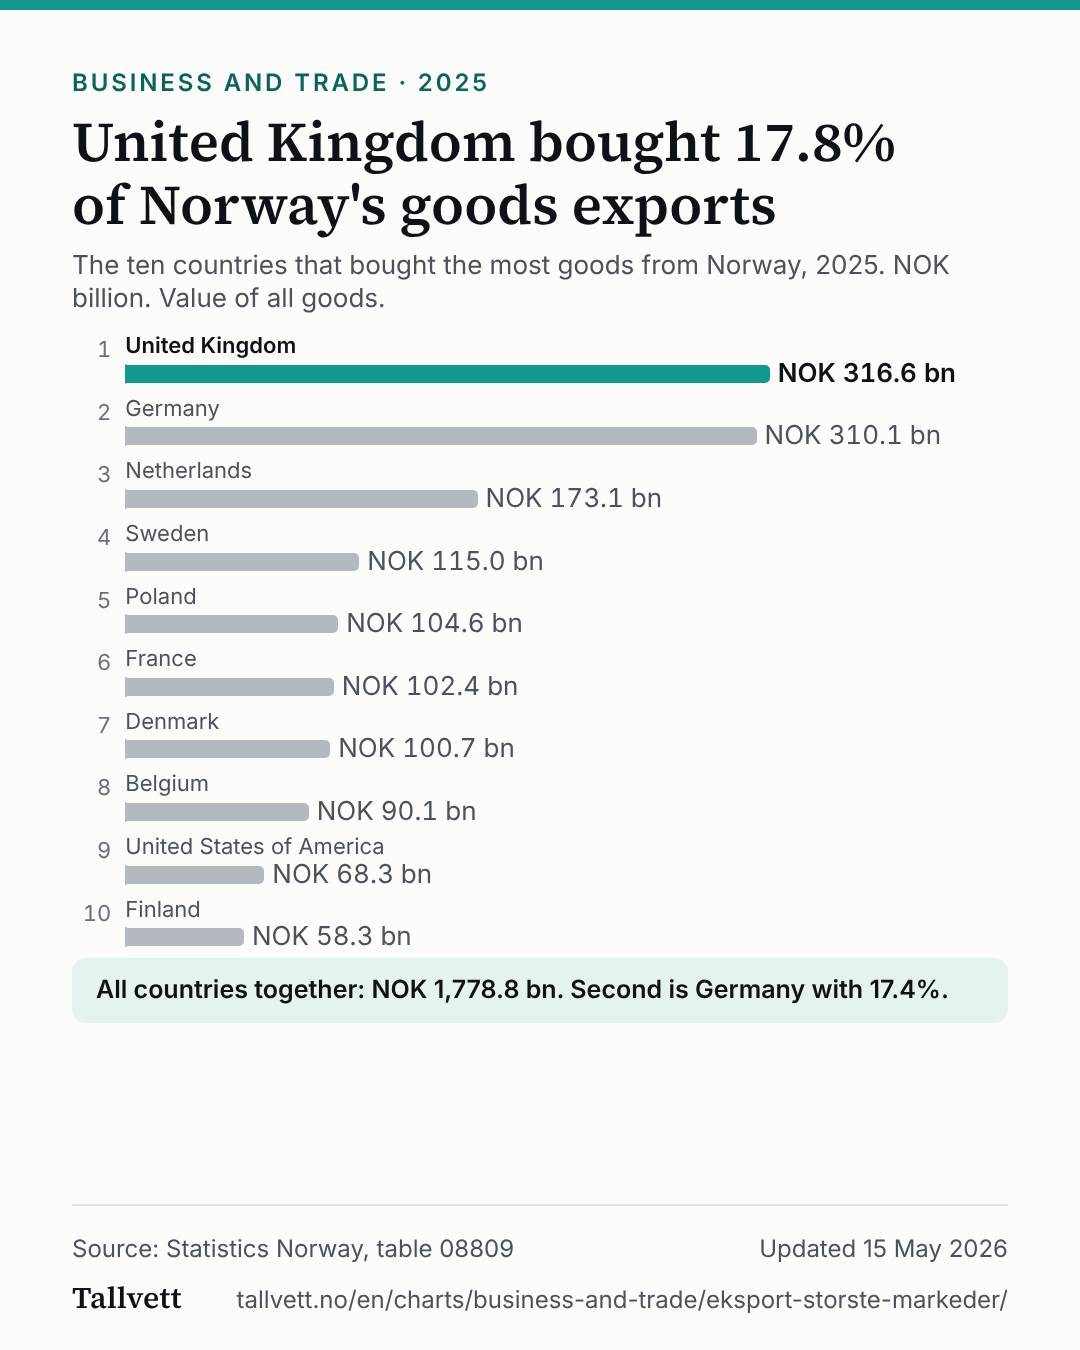
United Kingdom bought 17.8% of Norway's goods exports
The ten countries that bought the most goods from Norway, 2025. NOK billion. Value of all goods.
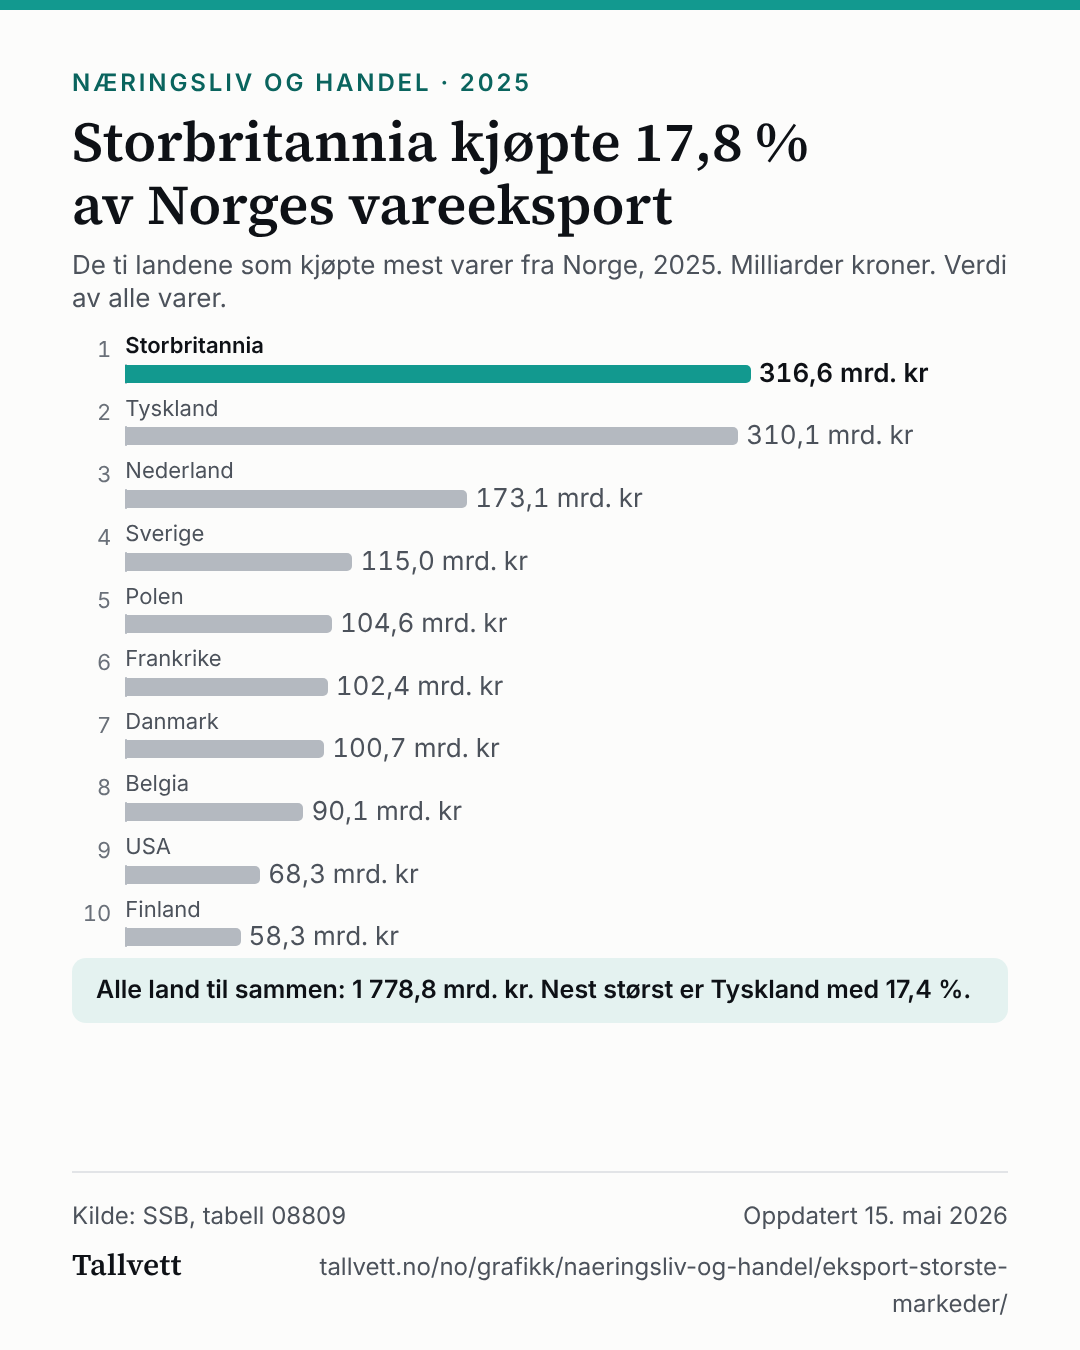
Ranked list of the ten most important export countries for Norwegian goods in 2025. 1. United Kingdom: NOK 316.6 bn; 2. Germany: NOK 310.1 bn; 3. Netherlands: NOK 173.1 bn; 4. Sweden: NOK 115.0 bn; 5. Poland: NOK 104.6 bn; 6. France: NOK 102.4 bn; 7. Denmark: NOK 100.7 bn; 8. Belgium: NOK 90.1 bn; 9. United States of America: NOK 68.3 bn; 10. Finland: NOK 58.3 bn.
- United KingdomNOK 316.6 bn
- GermanyNOK 310.1 bn
- NetherlandsNOK 173.1 bn
- SwedenNOK 115.0 bn
- PolandNOK 104.6 bn
- FranceNOK 102.4 bn
- DenmarkNOK 100.7 bn
- BelgiumNOK 90.1 bn
- United States of AmericaNOK 68.3 bn
- FinlandNOK 58.3 bn
All countries together: NOK 1,778.8 bn. Second is Germany with 17.4%.
Show the figures as a table
| Country | Share of goods exports | Export value |
|---|---|---|
| 1. United Kingdom | 17.8% | NOK 316.6 bn |
| 2. Germany | 17.4% | NOK 310.1 bn |
| 3. Netherlands | 9.7% | NOK 173.1 bn |
| 4. Sweden | 6.5% | NOK 115.0 bn |
| 5. Poland | 5.9% | NOK 104.6 bn |
| 6. France | 5.8% | NOK 102.4 bn |
| 7. Denmark | 5.7% | NOK 100.7 bn |
| 8. Belgium | 5.1% | NOK 90.1 bn |
| 9. United States of America | 3.8% | NOK 68.3 bn |
| 10. Finland | 3.3% | NOK 58.3 bn |
How this chart was made
- The values are Statistics Norway's own, from table 08809: exports of all goods, by country. We converted from thousands of kroner to billions of kroner and calculated the share: the country's value divided by the value for all countries.
- Only single countries are included. Groups such as the EU and the Nordic countries are left out, so no country is counted twice. Services are not included, only goods.
- The latest year's figures are provisional; Statistics Norway revises them twice.
Statistics Norway's notes on the table
- The current SITC-Rev.4 was introduced in January 2007, thereby replacing the previous SITC-Rev.3 (1988-2006). The commodity numbers and texts are the same, with the exception of SITC 599, which was a new addition to Rev.4. However, the correlation between the years before and after 2007 may be misleading for some of the commodity numbers. The extent of this will depend on the value of the commoditiy numbers that have been moved. Correspondence tables between the two versions can be wieved at the [UN web site](https://unstats.un.org/unsd/classifications/econ/).
- From 2006 on the following countries had their belonging to continent changed - Cyprus from Asia to Europe, and Armenia, Georgia, Kyrgyzstan, Kazakhstan, Tajikistan, Turkmenistan and Uzbekistan from Europe to Asia. The total for Trade are/continent includes this change - while in the selections of countries in the pull-down menu for European/Asian countries it is the present classification that will be shown for the whole time period (Cyprus belonging to Europe and the other countries to Asia).
- For more information, see About the statistics.
- Statistics for years are published for the first time in January of the following year (t + 1). The figures are then revised twice: for the first time in May of the following year (year t + 1), before final figures are published in May one year later (year t + 2).
- Due to confidentiality in group 56 from 2010 on, exports in this group can not be published separately. This group is therefore included in commodity group 59. For the imports of group 56 only the figures divided by country is suppressed. For the imports also group 27 is included in commodity group 29. Visualized by a colon (:) in the Statbank.
- . = Category not applicable. Figures do not exist at this time, because the category was not in use when the figures were collected.
- .. = Data not available. Figures have not been entered into our databases or are too unreliable to be published.
- - = Nil