Women's share of students ranges from 37.4% to 79.2% between fields of study
Women's share of students ranges from 37.4% to 79.2% between fields of study
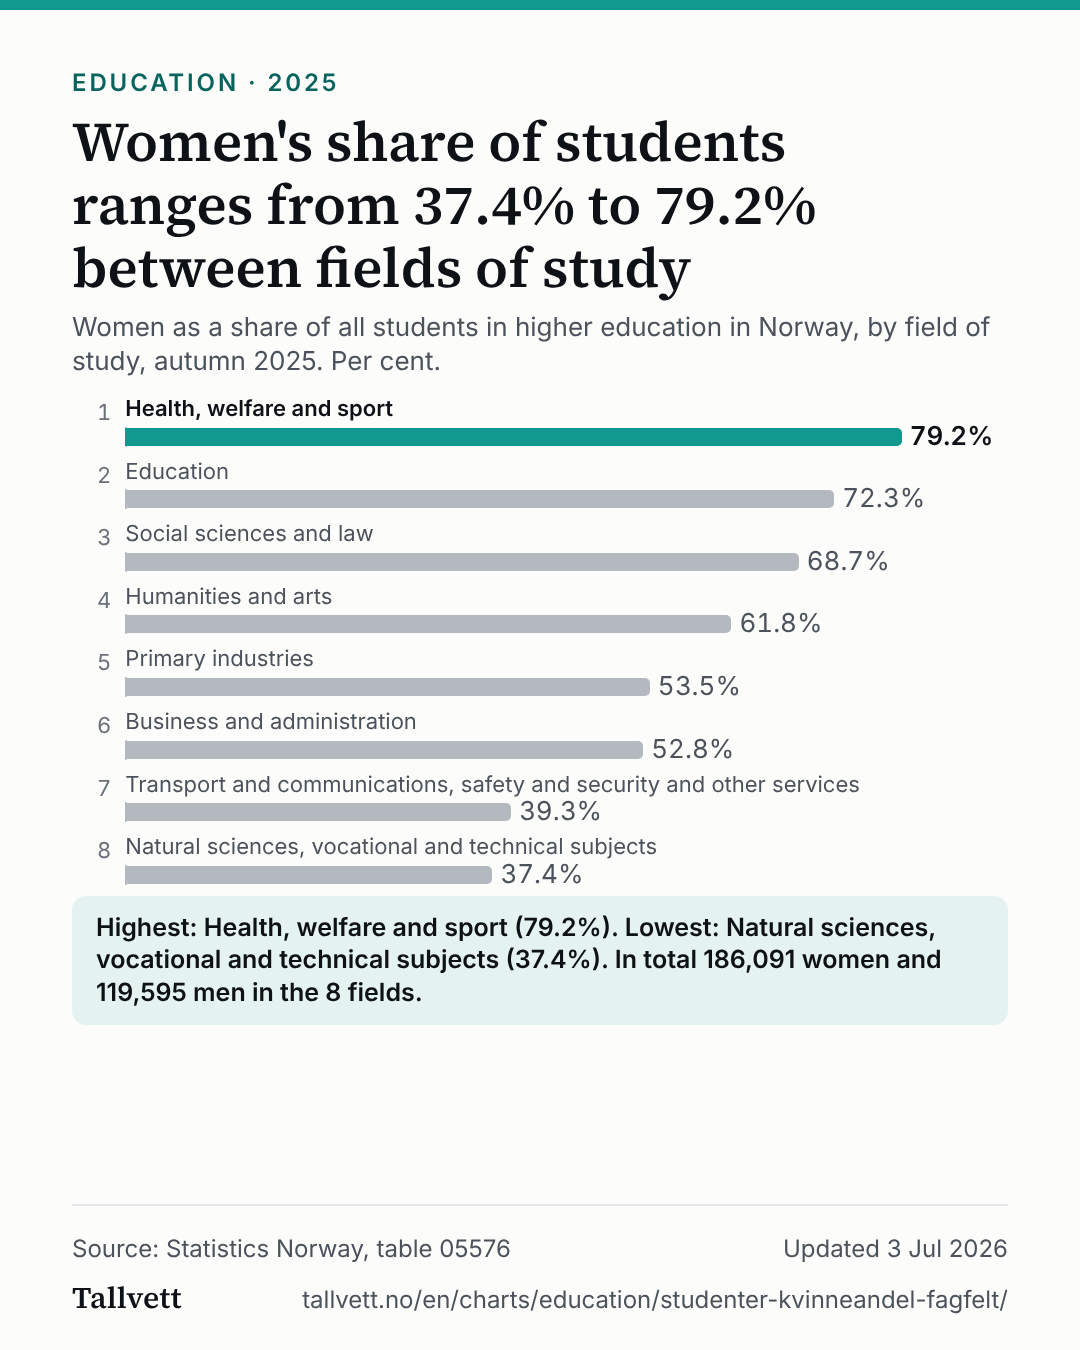
Women as a share of all students in higher education in Norway, by field of study, autumn 2025. Per cent.
Ranked list of women's share of students in higher education in 2025, by field of study. 1. Health, welfare and sport: 79.2%; 2. Education: 72.3%; 3. Social sciences and law: 68.7%; 4. Humanities and arts: 61.8%; 5. Primary industries: 53.5%; 6. Business and administration: 52.8%; 7. Transport and communications, safety and security and other services: 39.3%; 8. Natural sciences, vocational and technical subjects: 37.4%.
- Health, welfare and sport79.2%
- Education72.3%
- Social sciences and law68.7%
- Humanities and arts61.8%
- Primary industries53.5%
- Business and administration52.8%
- Transport and communications, safety and security and other services39.3%
- Natural sciences, vocational and technical subjects37.4%
Highest: Health, welfare and sport (79.2%). Lowest: Natural sciences, vocational and technical subjects (37.4%). In total 186,091 women and 119,595 men in the 8 fields.
Show the figures as a table
| Field of study | Women | Men | Women's share |
|---|---|---|---|
| 1. Health, welfare and sport | 49,935 | 13,102 | 79.2% |
| 2. Education | 32,170 | 12,311 | 72.3% |
| 3. Social sciences and law | 28,638 | 13,046 | 68.7% |
| 4. Humanities and arts | 17,013 | 10,497 | 61.8% |
| 5. Primary industries | 875 | 760 | 53.5% |
| 6. Business and administration | 32,833 | 29,299 | 52.8% |
| 7. Transport and communications, safety and security and other services | 4,326 | 6,669 | 39.3% |
| 8. Natural sciences, vocational and technical subjects | 20,301 | 33,911 | 37.4% |
How this chart was made
- The figures are Statistics Norway's own, from table 05576: students in higher education in Norway by sex and field of study. The share we calculated: women divided by women plus men in the field.
- We included the 8 fields with at least 1,000 students. Left out because they have fewer: General programmes. The group “unspecified” is not a field and is not included.
- Statistics Norway counts everyone registered as a student at universities and university colleges on 1 October, each student once. Students on leave and doctoral students are not included. Figures for one or two persons are rounded to 0 or 3.
- The share describes the split by sex in each field, not why it is as it is.
Statistics Norway's notes on the table
- As from 2025: All 1s and 2s have been replaced by 0 or 3 in order to meet confidentiality requirements. When the figures are aggregated to a higher level, the sum may differ slightly from the actual figure.