Charts · Income and living conditions
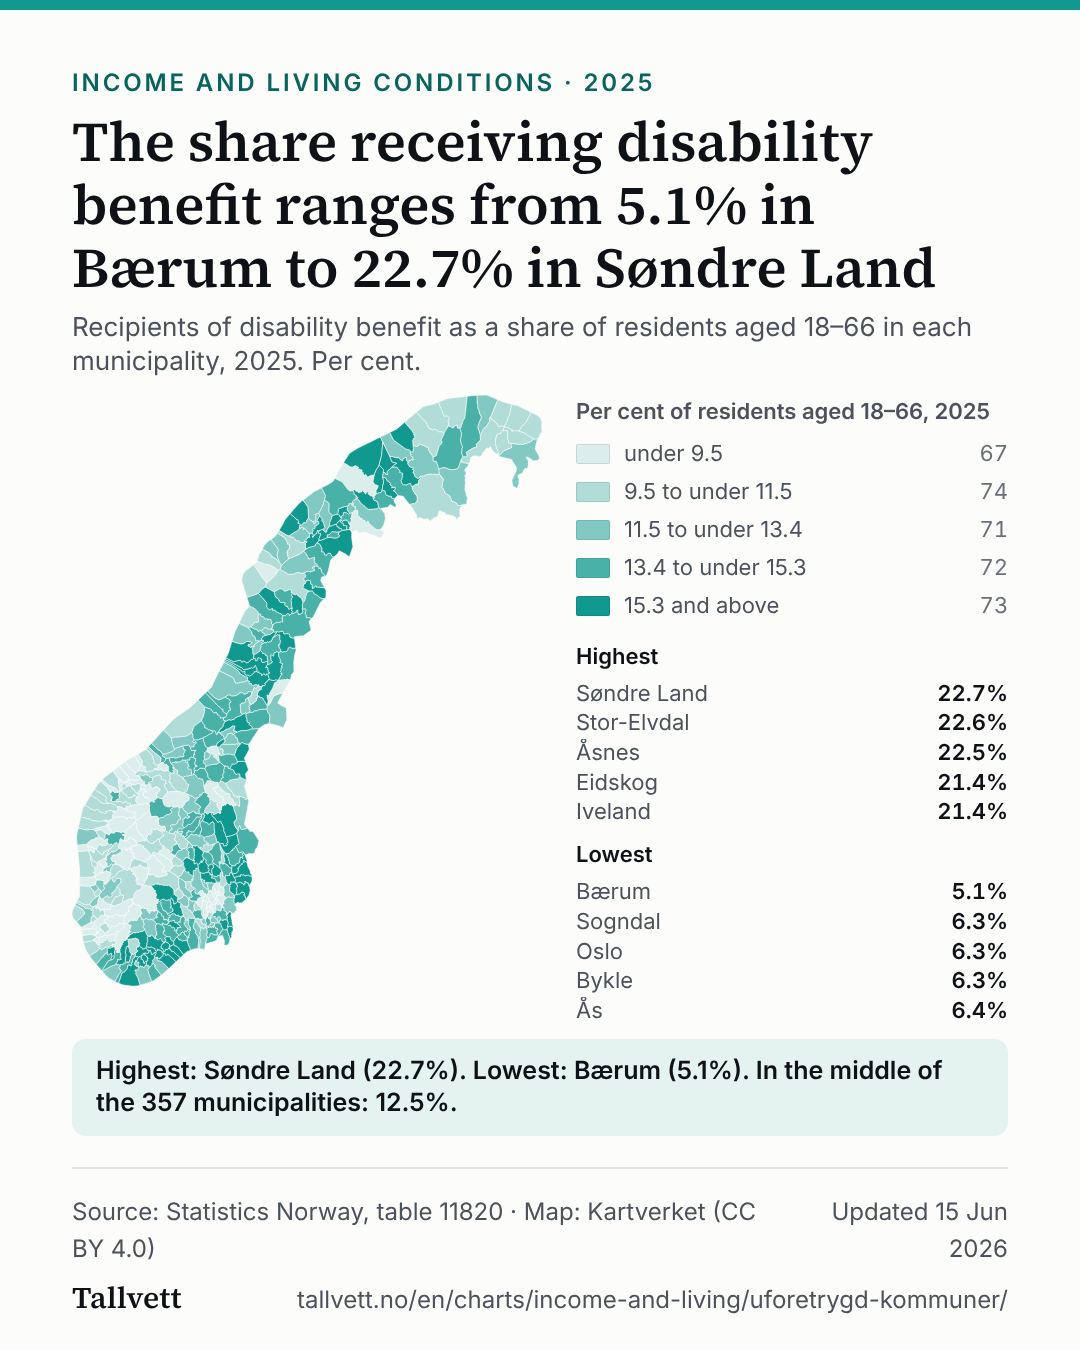
The share receiving disability benefit ranges from 5.1% in Bærum to 22.7% in Søndre Land
The share receiving disability benefit ranges from 5.1% in Bærum to 22.7% in Søndre Land
Recipients of disability benefit as a share of residents aged 18–66 in each municipality, 2025. Per cent.
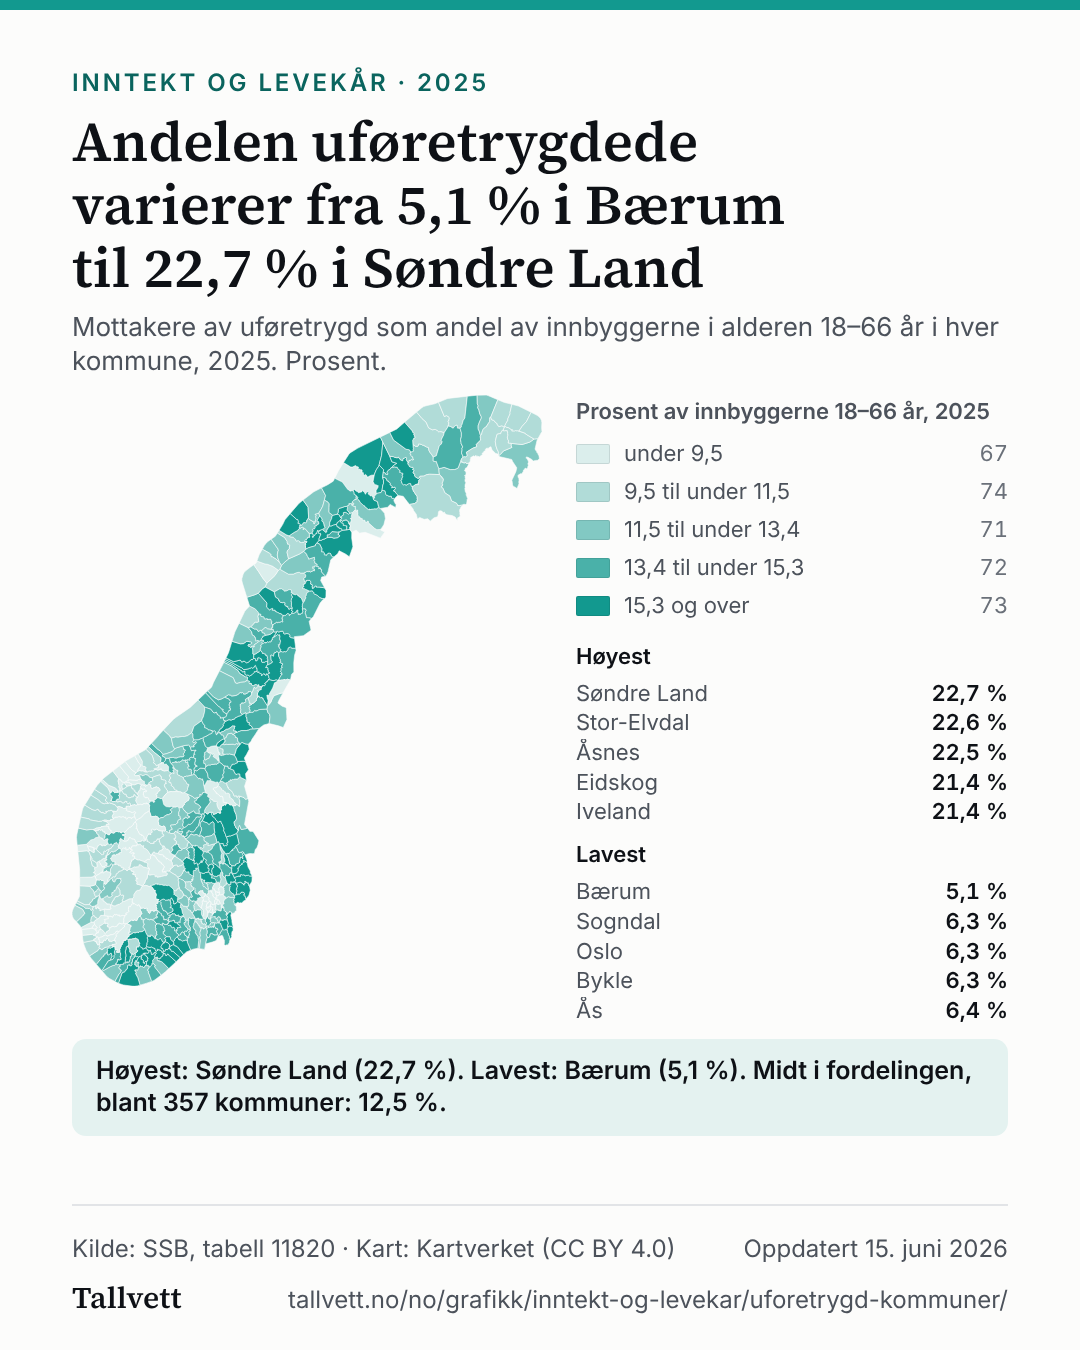
Map of the municipalities showing what share of residents aged 18–66 receive disability benefit in 2025. The highest are Søndre Land (22.7%), Stor-Elvdal (22.6%), Åsnes (22.5%), Eidskog (21.4%), Iveland (21.4%). The lowest are Bærum (5.1%), Sogndal (6.3%), Oslo (6.3%), Bykle (6.3%), Ås (6.4%).
Per cent of residents aged 18–66, 2025
- under 9.567
- 9.5 to under 11.574
- 11.5 to under 13.471
- 13.4 to under 15.372
- 15.3 and above73
Highest
- Søndre Land22.7%
- Stor-Elvdal22.6%
- Åsnes22.5%
- Eidskog21.4%
- Iveland21.4%
Lowest
- Bærum5.1%
- Sogndal6.3%
- Oslo6.3%
- Bykle6.3%
- Ås6.4%
Highest: Søndre Land (22.7%). Lowest: Bærum (5.1%). In the middle of the 357 municipalities: 12.5%.
Show the figures as a table
| Municipality | Disability benefit, per cent of residents aged 18–66 |
|---|---|
| 1. Søndre Land | 22.7% |
| 2. Stor-Elvdal | 22.6% |
| 3. Åsnes | 22.5% |
| 4. Eidskog | 21.4% |
| 5. Iveland | 21.4% |
| 6. Åmli | 21.2% |
| 7. Våler (Innlandet) | 21.1% |
| 8. Nordre Land | 20.9% |
| 9. Grue | 20.8% |
| 10. Gjerstad | 20.6% |
| 11. Kvænangen | 20.2% |
| 12. Nord-Odal | 20.1% |
| 13. Gratangen | 20.0% |
| 14. Bygland | 19.7% |
| 15. Dyrøy | 19.6% |
| 16. Froland | 19.1% |
| 17. Risør | 18.1% |
| 18. Lødingen | 18.0% |
| 19. Marker | 17.9% |
| 20. Tvedestrand | 17.9% |
| 21. Rendalen | 17.8% |
| 22. Loabák | 17.3% |
| 23. Gáivuotna | 17.2% |
| 24. Vennesla | 17.2% |
| 25. Bø | 17.1% |
| 26. Tydal | 17.1% |
| 27. Hasvik | 17.0% |
| 28. Øksnes | 17.0% |
| 29. Sør-Aurdal | 17.0% |
| 30. Beiarn | 16.9% |
| 31. Hemnes | 16.9% |
| 32. Leirfjord | 16.8% |
| 33. Bindal | 16.7% |
| 34. Kongsvinger | 16.7% |
| 35. Meråker | 16.7% |
| 36. Arendal | 16.6% |
| 37. Gran | 16.6% |
| 38. Lund | 16.6% |
| 39. Lyngen | 16.6% |
| 40. Notodden | 16.6% |
| 41. Evje og Hornnes | 16.5% |
| 42. Lindesnes | 16.5% |
| 43. Namsskogan | 16.5% |
| 44. Nome | 16.4% |
| 45. Frosta | 16.3% |
| 46. Vevelstad | 16.3% |
| 47. Grane | 16.2% |
| 48. Kvæfjord | 16.2% |
| 49. Løten | 16.2% |
| 50. Sør-Odal | 16.2% |
| 51. Tinn | 16.2% |
| 52. Sømna | 16.1% |
| 53. Vestre Toten | 16.0% |
| 54. Aremark | 15.9% |
| 55. Kragerø | 15.9% |
| 56. Vega | 15.9% |
| 57. Karlsøy | 15.7% |
| 58. Meløy | 15.7% |
| 59. Østre Toten | 15.7% |
| 60. Skjervøy | 15.7% |
| 61. Åmot | 15.6% |
| 62. Brønnøy | 15.6% |
| 63. Dielddanuorri | 15.6% |
| 64. Balsfjord | 15.5% |
| 65. Birkenes | 15.5% |
| 66. Fauske | 15.5% |
| 67. Rakkestad | 15.5% |
| 68. Steinkjer | 15.5% |
| 69. Vegårshei | 15.5% |
| 70. Kvinesdal | 15.4% |
| 71. Hægebostad | 15.3% |
| 72. Ibestad | 15.3% |
| 73. Narvik | 15.3% |
| 74. Gildeskål | 15.2% |
| 75. Hurdal | 15.2% |
| 76. Hvaler | 15.2% |
| 77. Vanylven | 15.2% |
| 78. Verdal | 15.2% |
| 79. Åfjord | 15.0% |
| 80. Bamble | 15.0% |
| 81. Orkland | 15.0% |
| 82. Drangedal | 14.9% |
| 83. Flekkefjord | 14.9% |
| 84. Grong | 14.9% |
| 85. Larvik | 14.9% |
| 86. Modum | 14.9% |
| 87. Vefsn | 14.9% |
| 88. Dønna | 14.8% |
| 89. Namsos | 14.8% |
| 90. Ørland | 14.8% |
| 91. Porsanger | 14.8% |
| 92. Sel | 14.8% |
| 93. Kviteseid | 14.7% |
| 94. Nord-Fron | 14.7% |
| 95. Halden | 14.6% |
| 96. Nissedal | 14.6% |
| 97. Sokndal | 14.6% |
| 98. Storfjord | 14.6% |
| 99. Holtålen | 14.4% |
| 100. Indre Fosen | 14.4% |
| 101. Rindal | 14.4% |
| 102. Saltdal | 14.4% |
| 103. Skjåk | 14.4% |
| 104. Sørfold | 14.4% |
| 105. Lebesby | 14.3% |
| 106. Lyngdal | 14.3% |
| 107. Senja | 14.3% |
| 108. Tingvoll | 14.3% |
| 109. Nordreisa | 14.2% |
| 110. Osen | 14.2% |
| 111. Rennebu | 14.2% |
| 112. Salangen | 14.2% |
| 113. Sarpsborg | 14.2% |
| 114. Evenes | 14.1% |
| 115. Hamarøy | 14.1% |
| 116. Elverum | 14.0% |
| 117. Gjøvik | 14.0% |
| 118. Hattfjelldal | 14.0% |
| 119. Kristiansund | 14.0% |
| 120. Rødøy | 14.0% |
| 121. Midt-Telemark | 13.9% |
| 122. Porsgrunn | 13.9% |
| 123. Ringsaker | 13.9% |
| 124. Skien | 13.9% |
| 125. Snåase | 13.9% |
| 126. Heim | 13.8% |
| 127. Indre Østfold | 13.8% |
| 128. Rana | 13.8% |
| 129. Ringebu | 13.8% |
| 130. Trysil | 13.8% |
| 131. Holmestrand | 13.7% |
| 132. Moss | 13.7% |
| 133. Stange | 13.7% |
| 134. Etnedal | 13.6% |
| 135. Folldal | 13.6% |
| 136. Hjartdal | 13.6% |
| 137. Midtre Gauldal | 13.6% |
| 138. Vestre Slidre | 13.6% |
| 139. Høyanger | 13.5% |
| 140. Lillesand | 13.5% |
| 141. Selbu | 13.5% |
| 142. Sør-Fron | 13.5% |
| 143. Flatanger | 13.4% |
| 144. Fredrikstad | 13.4% |
| 145. Seljord | 13.4% |
| 146. Nærøysund | 13.3% |
| 147. Øvre Eiker | 13.3% |
| 148. Ringerike | 13.3% |
| 149. Sandefjord | 13.3% |
| 150. Tokke | 13.3% |
| 151. Vaksdal | 13.3% |
| 152. Alstahaug | 13.2% |
| 153. Farsund | 13.2% |
| 154. Samnanger | 13.2% |
| 155. Sortland | 13.2% |
| 156. Leka | 13.1% |
| 157. Loppa | 13.1% |
| 158. Nesna | 13.1% |
| 159. Smøla | 13.1% |
| 160. Vågå | 13.1% |
| 161. Inderøy | 13.0% |
| 162. Nord-Aurdal | 13.0% |
| 163. Stjørdal | 13.0% |
| 164. Gamvik | 12.9% |
| 165. Jevnaker | 12.9% |
| 166. Sør-Varanger | 12.9% |
| 167. Flakstad | 12.8% |
| 168. Steigen | 12.8% |
| 169. Aure | 12.7% |
| 170. Grimstad | 12.7% |
| 171. Lurøy | 12.7% |
| 172. Dovre | 12.6% |
| 173. Færder | 12.6% |
| 174. Gausdal | 12.6% |
| 175. Skiptvet | 12.6% |
| 176. Sørreisa | 12.6% |
| 177. Våler (Østfold) | 12.6% |
| 178. Øyer | 12.5% |
| 179. Råde | 12.5% |
| 180. Eigersund | 12.4% |
| 181. Fyresdal | 12.4% |
| 182. Karmøy | 12.4% |
| 183. Overhalla | 12.4% |
| 184. Harstad | 12.3% |
| 185. Kvinnherad | 12.3% |
| 186. Levanger | 12.3% |
| 187. Lunner | 12.3% |
| 188. Solund | 12.3% |
| 189. Hadsel | 12.2% |
| 190. Kristiansand | 12.2% |
| 191. Horten | 12.1% |
| 192. Oppdal | 12.1% |
| 193. Skaun | 12.1% |
| 194. Engerdal | 12.0% |
| 195. Lom | 12.0% |
| 196. Sigdal | 12.0% |
| 197. Surnadal | 12.0% |
| 198. Alta | 11.9% |
| 199. Flå | 11.9% |
| 200. Hitra | 11.9% |
| 201. Målselv | 11.9% |
| 202. Siljan | 11.9% |
| 203. Andøy | 11.8% |
| 204. Herøy (Nordland) | 11.8% |
| 205. Nes | 11.8% |
| 206. Flesberg | 11.7% |
| 207. Tysnes | 11.7% |
| 208. Valle | 11.7% |
| 209. Vestnes | 11.7% |
| 210. Aurskog-Høland | 11.6% |
| 211. Lierne | 11.6% |
| 212. Sveio | 11.6% |
| 213. Vestvågøy | 11.6% |
| 214. Fitjar | 11.5% |
| 215. Kárášjohka | 11.5% |
| 216. Melhus | 11.5% |
| 217. Nesbyen | 11.4% |
| 218. Rollag | 11.4% |
| 219. Kvam | 11.3% |
| 220. Alvdal | 11.2% |
| 221. Bokn | 11.2% |
| 222. Drammen | 11.2% |
| 223. Hamar | 11.2% |
| 224. Herøy (Møre og Romsdal) | 11.2% |
| 225. Krødsherad | 11.2% |
| 226. Ørsta | 11.2% |
| 227. Øygarden | 11.2% |
| 228. Rauma | 11.2% |
| 229. Vardø | 11.2% |
| 230. Åseral | 11.1% |
| 231. Øystre Slidre | 11.1% |
| 232. Kongsberg | 11.0% |
| 233. Sauda | 11.0% |
| 234. Alver | 10.9% |
| 235. Deatnu | 10.9% |
| 236. Eidsvoll | 10.9% |
| 237. Guovdageaidnu | 10.9% |
| 238. Haugesund | 10.9% |
| 239. Røros | 10.9% |
| 240. Bjerkreim | 10.8% |
| 241. Hareid | 10.7% |
| 242. Malvik | 10.7% |
| 243. Nordkapp | 10.7% |
| 244. Røst | 10.7% |
| 245. Vadsø | 10.7% |
| 246. Vågan | 10.7% |
| 247. Averøy | 10.6% |
| 248. Hå | 10.6% |
| 249. Tønsberg | 10.6% |
| 250. Årdal | 10.5% |
| 251. Hammerfest | 10.5% |
| 252. Moskenes | 10.5% |
| 253. Stord | 10.5% |
| 254. Sykkylven | 10.5% |
| 255. Bremanger | 10.4% |
| 256. Enebakk | 10.4% |
| 257. Frøya | 10.4% |
| 258. Kinn | 10.4% |
| 259. Sunndal | 10.4% |
| 260. Utsira | 10.4% |
| 261. Strand | 10.3% |
| 262. Os | 10.2% |
| 263. Stad | 10.2% |
| 264. Vang | 10.1% |
| 265. Etne | 10.0% |
| 266. Høylandet | 10.0% |
| 267. Hustadvika | 10.0% |
| 268. Askøy | 9.9% |
| 269. Bømlo | 9.9% |
| 270. Måsøy | 9.9% |
| 271. Modalen | 9.9% |
| 272. Hyllestad | 9.8% |
| 273. Klepp | 9.8% |
| 274. Båtsfjord | 9.7% |
| 275. Masfjorden | 9.7% |
| 276. Træna | 9.7% |
| 277. Tysvær | 9.7% |
| 278. Ulvik | 9.7% |
| 279. Vestby | 9.7% |
| 280. Volda | 9.7% |
| 281. Askvoll | 9.6% |
| 282. Berlevåg | 9.6% |
| 283. Lillehammer | 9.6% |
| 284. Ullensvang | 9.6% |
| 285. Unjárga | 9.6% |
| 286. Bodø | 9.5% |
| 287. Gol | 9.5% |
| 288. Lærdal | 9.5% |
| 289. Molde | 9.5% |
| 290. Nore og Uvdal | 9.5% |
| 291. Austrheim | 9.4% |
| 292. Luster | 9.4% |
| 293. Osterøy | 9.4% |
| 294. Vinje | 9.3% |
| 295. Fedje | 9.2% |
| 296. Gjemnes | 9.2% |
| 297. Haram | 9.2% |
| 298. Nesodden | 9.2% |
| 299. Sande | 9.2% |
| 300. Suldal | 9.2% |
| 301. Vik | 9.2% |
| 302. Voss | 9.2% |
| 303. Frogn | 9.0% |
| 304. Time | 9.0% |
| 305. Værøy | 9.0% |
| 306. Tynset | 8.9% |
| 307. Aukra | 8.8% |
| 308. Bjørnafjorden | 8.8% |
| 309. Gjesdal | 8.8% |
| 310. Fjaler | 8.7% |
| 311. Fjord | 8.7% |
| 312. Sirdal | 8.7% |
| 313. Trondheim | 8.7% |
| 314. Vindafjord | 8.6% |
| 315. Gjerdrum | 8.5% |
| 316. Lesja | 8.5% |
| 317. Sandnes | 8.5% |
| 318. Randaberg | 8.4% |
| 319. Hol | 8.3% |
| 320. Lier | 8.3% |
| 321. Raarvihke | 8.3% |
| 322. Sula | 8.3% |
| 323. Hjelmeland | 8.2% |
| 324. Gloppen | 8.1% |
| 325. Kvitsøy | 8.1% |
| 326. Nannestad | 8.1% |
| 327. Ålesund | 8.0% |
| 328. Giske | 8.0% |
| 329. Tolga | 8.0% |
| 330. Tromsø | 8.0% |
| 331. Hole | 7.9% |
| 332. Ullensaker | 7.9% |
| 333. Ulstein | 7.9% |
| 334. Bergen | 7.8% |
| 335. Eidfjord | 7.8% |
| 336. Lillestrøm | 7.8% |
| 337. Nittedal | 7.7% |
| 338. Sunnfjord | 7.7% |
| 339. Ål | 7.5% |
| 340. Gulen | 7.5% |
| 341. Stavanger | 7.4% |
| 342. Stranda | 7.4% |
| 343. Austevoll | 7.3% |
| 344. Asker | 7.2% |
| 345. Nordre Follo | 7.2% |
| 346. Stryn | 7.2% |
| 347. Bardu | 7.0% |
| 348. Lørenskog | 7.0% |
| 349. Hemsedal | 6.8% |
| 350. Rælingen | 6.8% |
| 351. Aurland | 6.7% |
| 352. Sola | 6.6% |
| 353. Ås | 6.4% |
| 354. Bykle | 6.3% |
| 355. Oslo | 6.3% |
| 356. Sogndal | 6.3% |
| 357. Bærum | 5.1% |
How this chart was made
- The figures are Statistics Norway's own, from table 11820: recipients of disability benefit aged 18–66 as a share of the residents of the same age group in the municipality. We have not calculated them.
- Disability benefit is paid to people whose lasting ability to work has been reduced. The figures count recipients, not the reason they receive it.
- The municipalities are split into five classes with about the same number of municipalities in each (quintiles), calculated by us. The bounds are rounded to one decimal; each class includes its lower bound and not its upper. The colour therefore shows the order of the municipalities, not how large the differences are.
- The municipal boundaries are from Kartverket (Administrative units, municipalities, reference date 1 January 2026, CC BY 4.0), simplified to 300 metres for drawing. They carry no figures. Svalbard is not included.
- Small municipalities have few residents, so the figures there can swing a lot from year to year. The map shows where the share is high or low, not why. Age structure and the local economy are not taken into account.
Statistics Norway's notes on the table
- Some selected key figures for the population of a municipality
- See list over changes in regional classifications (in Norwegian).
- .. = Data not available. Figures have not been entered into our databases or are too unreliable to be published.
- . = Category not applicable. Figures do not exist at this time, because the category was not in use when the figures were collected.