Property tax per resident is highest in Aukra: NOK 70,556
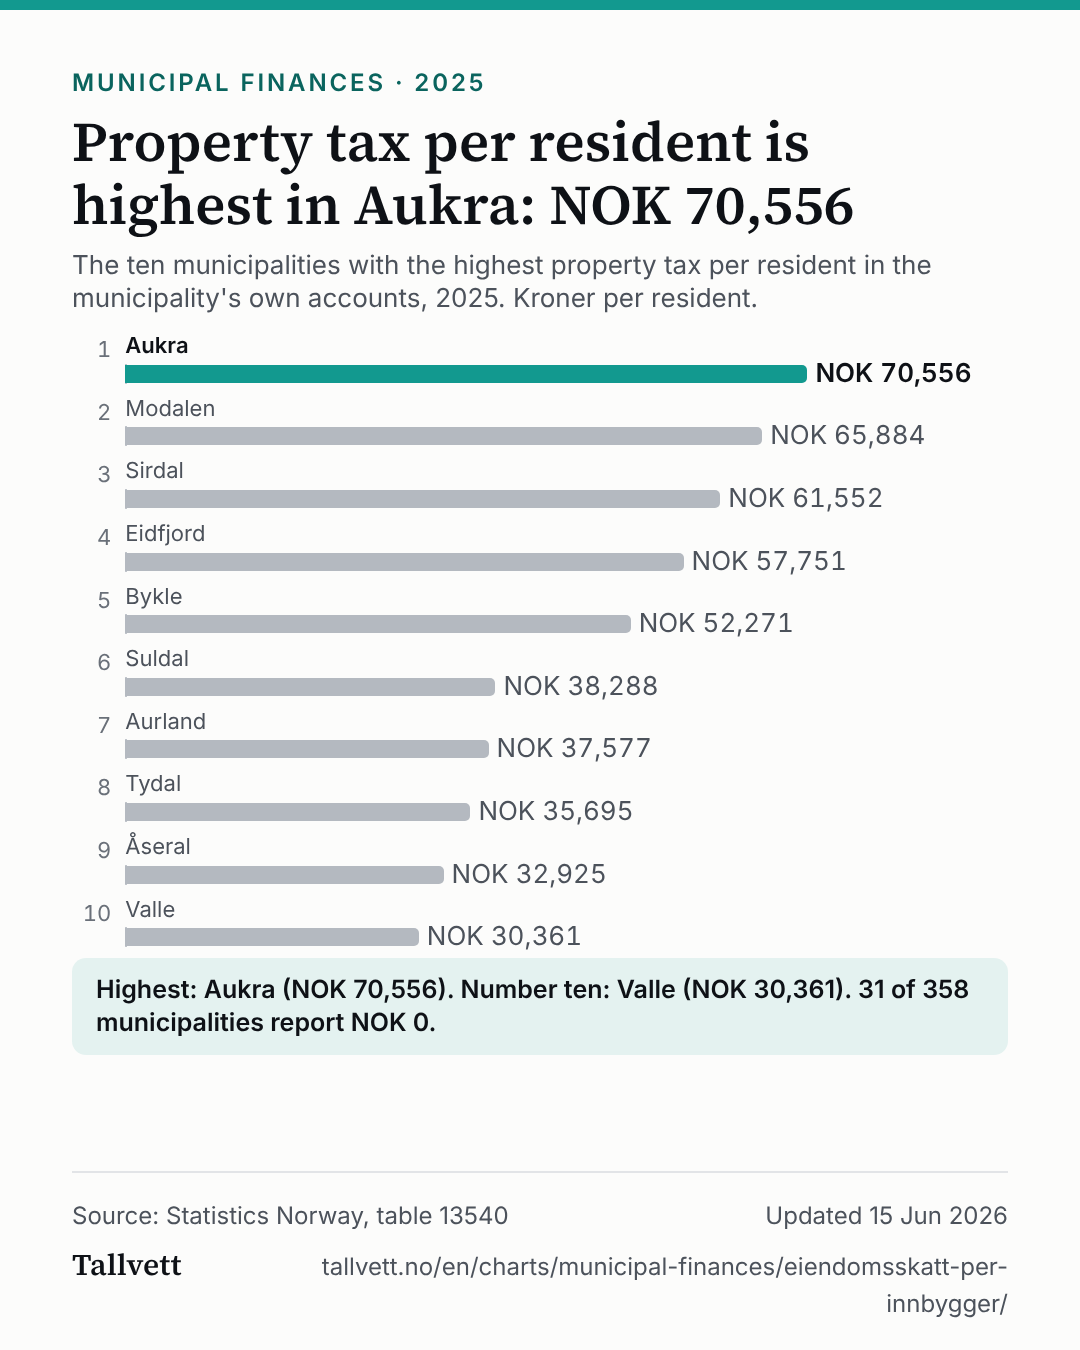
Property tax per resident is highest in Aukra: NOK 70,556
The ten municipalities with the highest property tax per resident in the municipality's own accounts, 2025. Kroner per resident.
Ranked list of the ten municipalities with the highest property tax per resident in 2025. 1. Aukra: NOK 70,556; 2. Modalen: NOK 65,884; 3. Sirdal: NOK 61,552; 4. Eidfjord: NOK 57,751; 5. Bykle: NOK 52,271; 6. Suldal: NOK 38,288; 7. Aurland: NOK 37,577; 8. Tydal: NOK 35,695; 9. Åseral: NOK 32,925; 10. Valle: NOK 30,361.
- AukraNOK 70,556
- ModalenNOK 65,884
- SirdalNOK 61,552
- EidfjordNOK 57,751
- BykleNOK 52,271
- SuldalNOK 38,288
- AurlandNOK 37,577
- TydalNOK 35,695
- ÅseralNOK 32,925
- ValleNOK 30,361
Highest: Aukra (NOK 70,556). Number ten: Valle (NOK 30,361). 31 of 358 municipalities report NOK 0.
Show the figures as a table
| Municipality | Property tax per resident |
|---|---|
| 1. Aukra | NOK 70,556 |
| 2. Modalen | NOK 65,884 |
| 3. Sirdal | NOK 61,552 |
| 4. Eidfjord | NOK 57,751 |
| 5. Bykle | NOK 52,271 |
| 6. Suldal | NOK 38,288 |
| 7. Aurland | NOK 37,577 |
| 8. Tydal | NOK 35,695 |
| 9. Åseral | NOK 32,925 |
| 10. Valle | NOK 30,361 |
How this chart was made
- The figures are Statistics Norway's own, from table 13540: property tax per resident in the municipality's own accounts (not the consolidated group). We have not calculated them; we chose the ten highest among 358 municipalities with a figure for 2025 and counted how many report NOK 0.
- The table does not explain why the amounts differ, and neither do we. Property tax is a municipal tax that not every municipality levies, and it can fall on different kinds of property. Merged municipalities without a figure for 2025 are not included.
- Small municipalities have few residents, so the amount per resident can swing a lot from year to year.
Statistics Norway's notes on the table
- The table gives a summary of the relevant accounting classifications in relation to the population.
- For explanations of specific data issues, adjustments to published figures, breaks in time series, and municipal mergers, see Structural explanations and the correction log (in Norwegian).
- . = Category not applicable. Figures do not exist at this time, because the category was not in use when the figures were collected.