Charts · Nature and environment
Transport accounts for 43% of greenhouse gas emissions
Transport accounts for 43% of greenhouse gas emissions
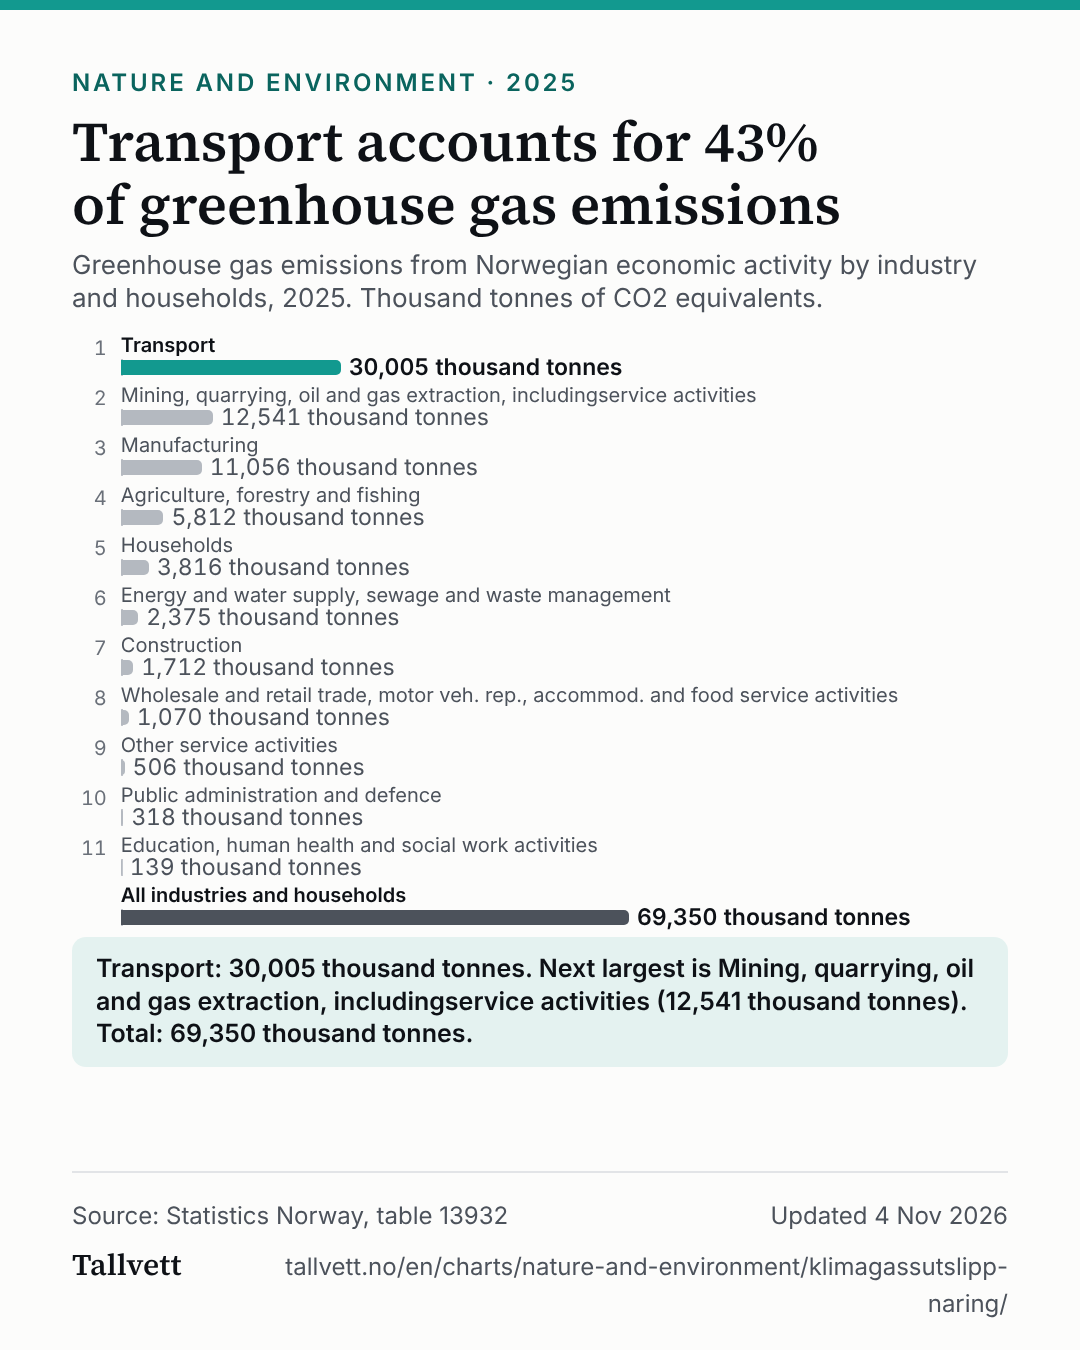
Greenhouse gas emissions from Norwegian economic activity by industry and households, 2025. Thousand tonnes of CO2 equivalents.
Ranked list of greenhouse gas emissions from Norwegian economic activity in 2025, by industry and households. 1. Transport: 30,005 thousand tonnes; 2. Mining, quarrying, oil and gas extraction, includingservice activities: 12,541 thousand tonnes; 3. Manufacturing: 11,056 thousand tonnes; 4. Agriculture, forestry and fishing: 5,812 thousand tonnes; 5. Households: 3,816 thousand tonnes; 6. Energy and water supply, sewage and waste management: 2,375 thousand tonnes; 7. Construction: 1,712 thousand tonnes; 8. Wholesale and retail trade, motor veh. rep., accommod. and food service activities: 1,070 thousand tonnes; 9. Other service activities: 506 thousand tonnes; 10. Public administration and defence: 318 thousand tonnes; 11. Education, human health and social work activities: 139 thousand tonnes; All industries and households: 69,350 thousand tonnes.
- Transport30,005 thousand tonnes
- Mining, quarrying, oil and gas extraction, includingservice activities12,541 thousand tonnes
- Manufacturing11,056 thousand tonnes
- Agriculture, forestry and fishing5,812 thousand tonnes
- Households3,816 thousand tonnes
- Energy and water supply, sewage and waste management2,375 thousand tonnes
- Construction1,712 thousand tonnes
- Wholesale and retail trade, motor veh. rep., accommod. and food service activities1,070 thousand tonnes
- Other service activities506 thousand tonnes
- Public administration and defence318 thousand tonnes
- Education, human health and social work activities139 thousand tonnes
- All industries and households69,350 thousand tonnes
Transport: 30,005 thousand tonnes. Next largest is Mining, quarrying, oil and gas extraction, includingservice activities (12,541 thousand tonnes). Total: 69,350 thousand tonnes.
Show the figures as a table
| Source | Thousand tonnes of CO2 equivalents |
|---|---|
| 1. Transport | 30,005 thousand tonnes |
| 2. Mining, quarrying, oil and gas extraction, includingservice activities | 12,541 thousand tonnes |
| 3. Manufacturing | 11,056 thousand tonnes |
| 4. Agriculture, forestry and fishing | 5,812 thousand tonnes |
| 5. Households | 3,816 thousand tonnes |
| 6. Energy and water supply, sewage and waste management | 2,375 thousand tonnes |
| 7. Construction | 1,712 thousand tonnes |
| 8. Wholesale and retail trade, motor veh. rep., accommod. and food service activities | 1,070 thousand tonnes |
| 9. Other service activities | 506 thousand tonnes |
| 10. Public administration and defence | 318 thousand tonnes |
| 11. Education, human health and social work activities | 139 thousand tonnes |
| All industries and households | 69,350 thousand tonnes |
How this chart was made
- The figures are Statistics Norway's own, from table 13932: total greenhouse gas emissions, in CO2 equivalents by the method of the Paris Agreement (AR5). We have not calculated them.
- The only thing we calculated is the share in the headline: the largest source's emissions divided by the total.
- The figures cover Norwegian economic activity, and Statistics Norway's note says they include ocean transport and international air transport. That is not the same as emissions within Norway's borders.
- The industries are Statistics Norway's ten main groups. The sum of the parts may differ slightly from the total because of rounding.
Statistics Norway's notes on the table
- Due to rounding error, the total may not match the sum of subgroups.
- Includes ocean transport and international air transport.
- The table contains CO2 equivalents (GWP-values) according to AR5, the IPCCs Fifth Assessment Report, which are used in the Paris Agreement.
- Road traffic was updated in the November 2026 publication. The change affects total emissions and emissions from road traffic for the time series from 1990 onwards.