House prices are 8.1 times as high as in 1992, before adjusting for inflation
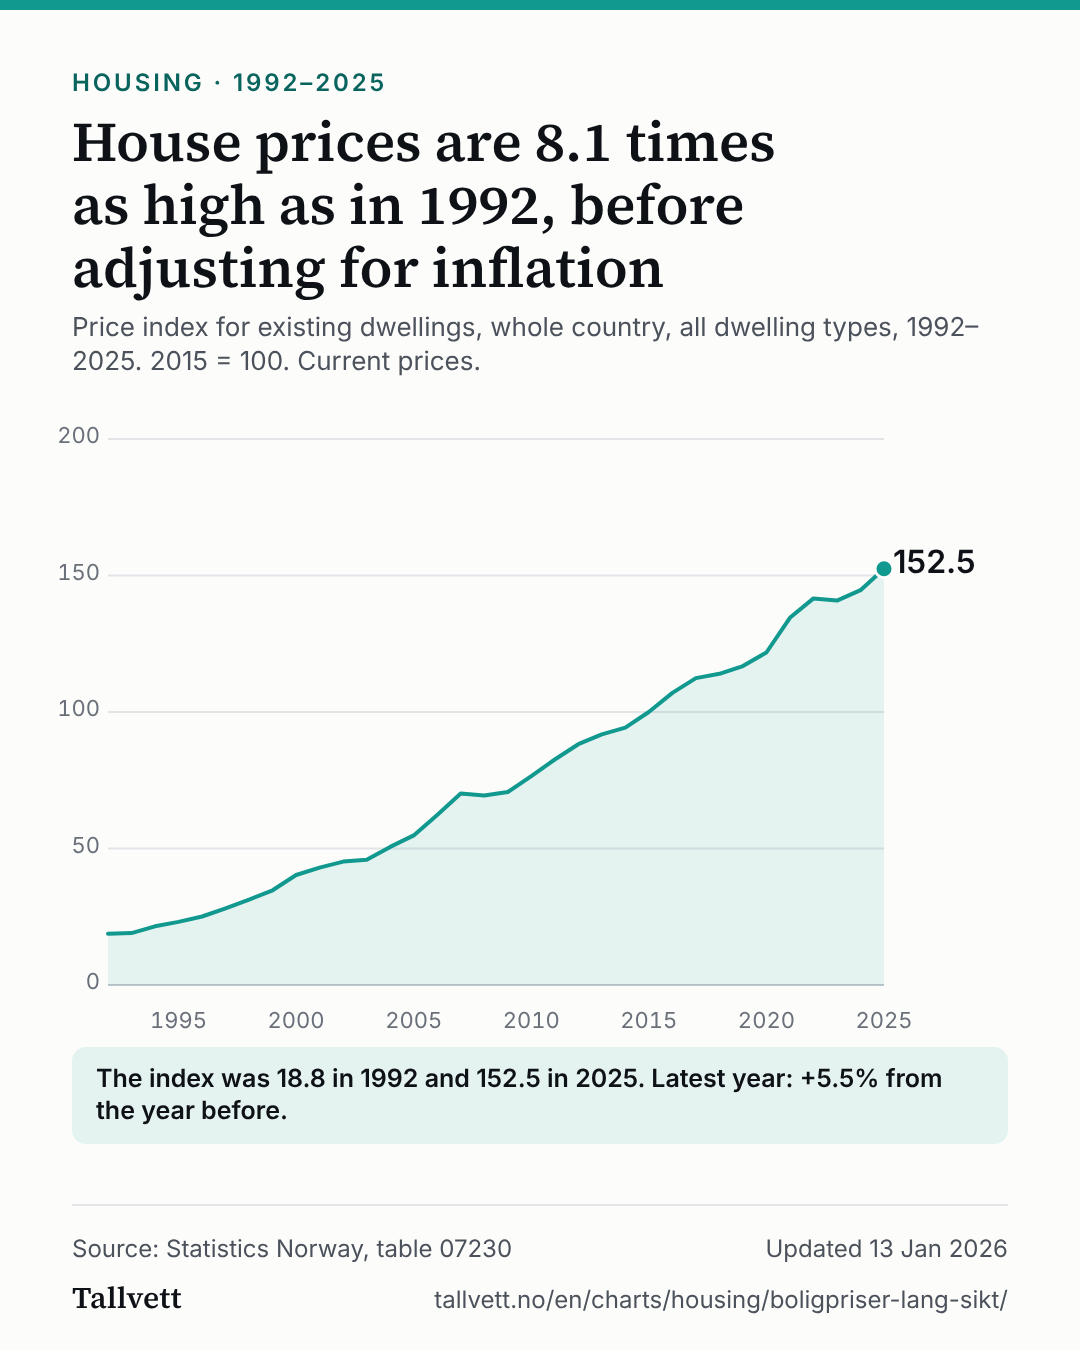
House prices are 8.1 times as high as in 1992, before adjusting for inflation
Price index for existing dwellings, whole country, all dwelling types, 1992–2025. 2015 = 100. Current prices.
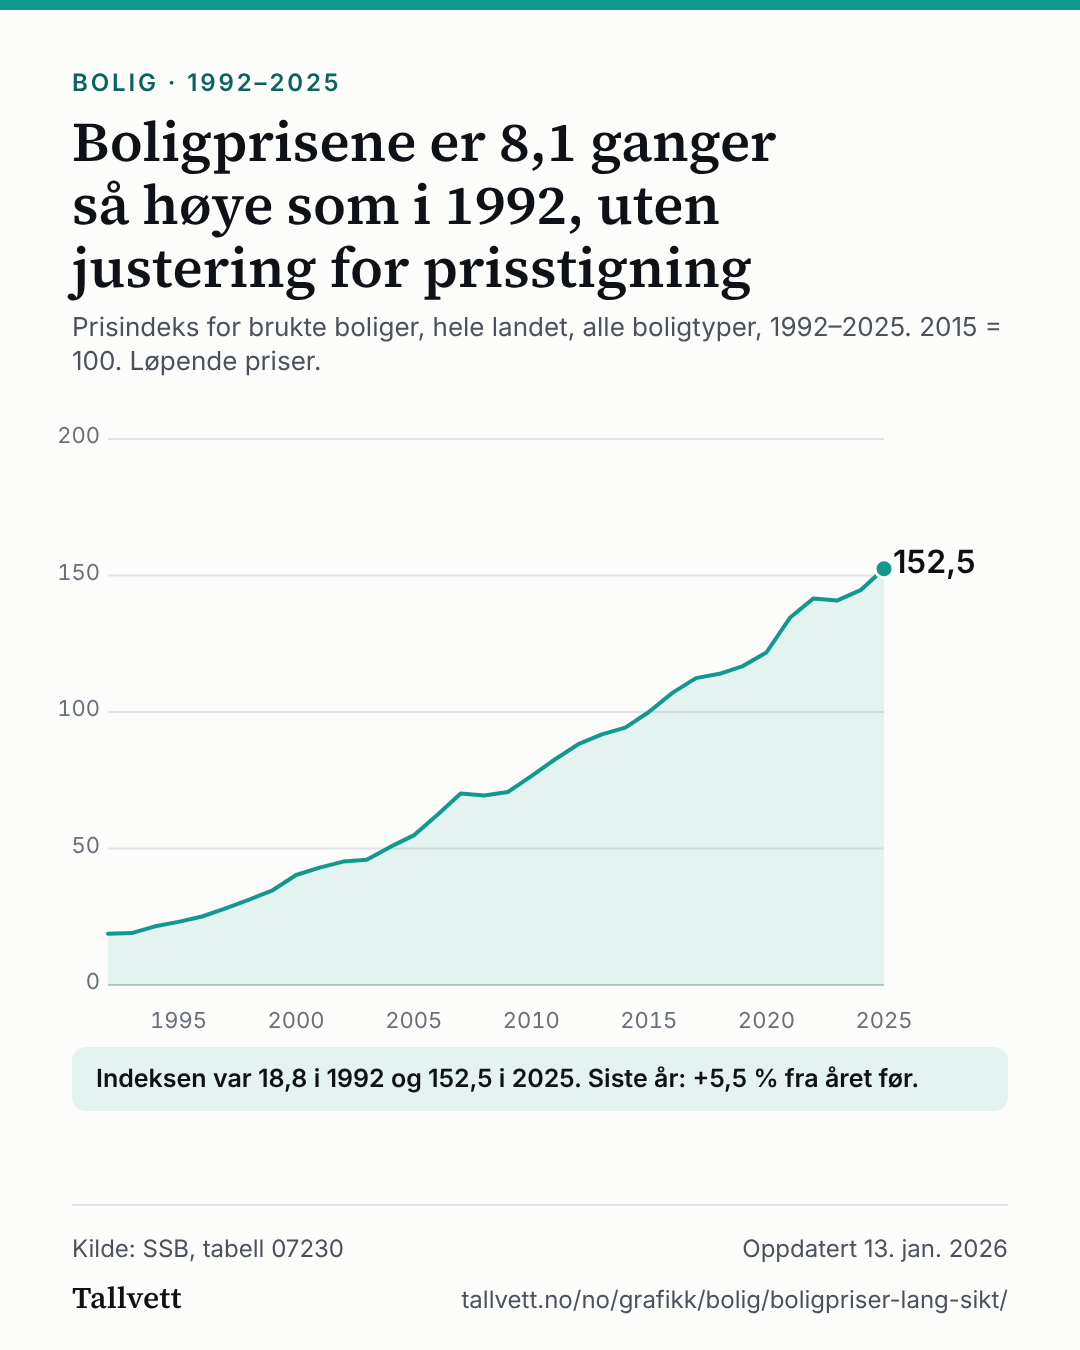
Line chart of the price index for existing dwellings in Norway from 1992 to 2025, with 2015 as 100. The index was 18.8 in 1992 and 152.5 in 2025.
The index was 18.8 in 1992 and 152.5 in 2025. Latest year: +5.5% from the year before.
Show the figures as a table
| Period | Price index, 2015 = 100 |
|---|---|
| 2025 | 152.5 |
| 2024 | 144.6 |
| 2023 | 140.8 |
| 2022 | 141.6 |
| 2021 | 134.5 |
| 2020 | 121.8 |
| 2019 | 116.8 |
| 2018 | 114.0 |
| 2017 | 112.4 |
| 2016 | 107.0 |
| 2015 | 100.0 |
| 2014 | 94.3 |
| 2013 | 91.8 |
| 2012 | 88.2 |
| 2011 | 82.6 |
| 2010 | 76.5 |
| 2009 | 70.7 |
| 2008 | 69.4 |
| 2007 | 70.1 |
| 2006 | 62.3 |
| 2005 | 54.8 |
| 2004 | 50.6 |
| 2003 | 45.9 |
| 2002 | 45.2 |
| 2001 | 43.0 |
| 2000 | 40.3 |
| 1999 | 34.7 |
| 1998 | 31.3 |
| 1997 | 28.1 |
| 1996 | 25.1 |
| 1995 | 23.1 |
| 1994 | 21.5 |
| 1993 | 19.0 |
| 1992 | 18.8 |
How this chart was made
- The figures are Statistics Norway's own, from table 07230: price index for existing dwellings, whole country, all dwelling types together, per year (2015 = 100). We have not calculated the index.
- We calculated the number in the headline: the last year's index divided by the first year's index. The change in the latest year is the last index against the year before, in per cent.
- The prices are current (nominal): they are not adjusted for inflation. How much house prices have risen beyond prices in general, this index does not say.