Oslo has the most expensive homes: NOK 98,381 per square metre
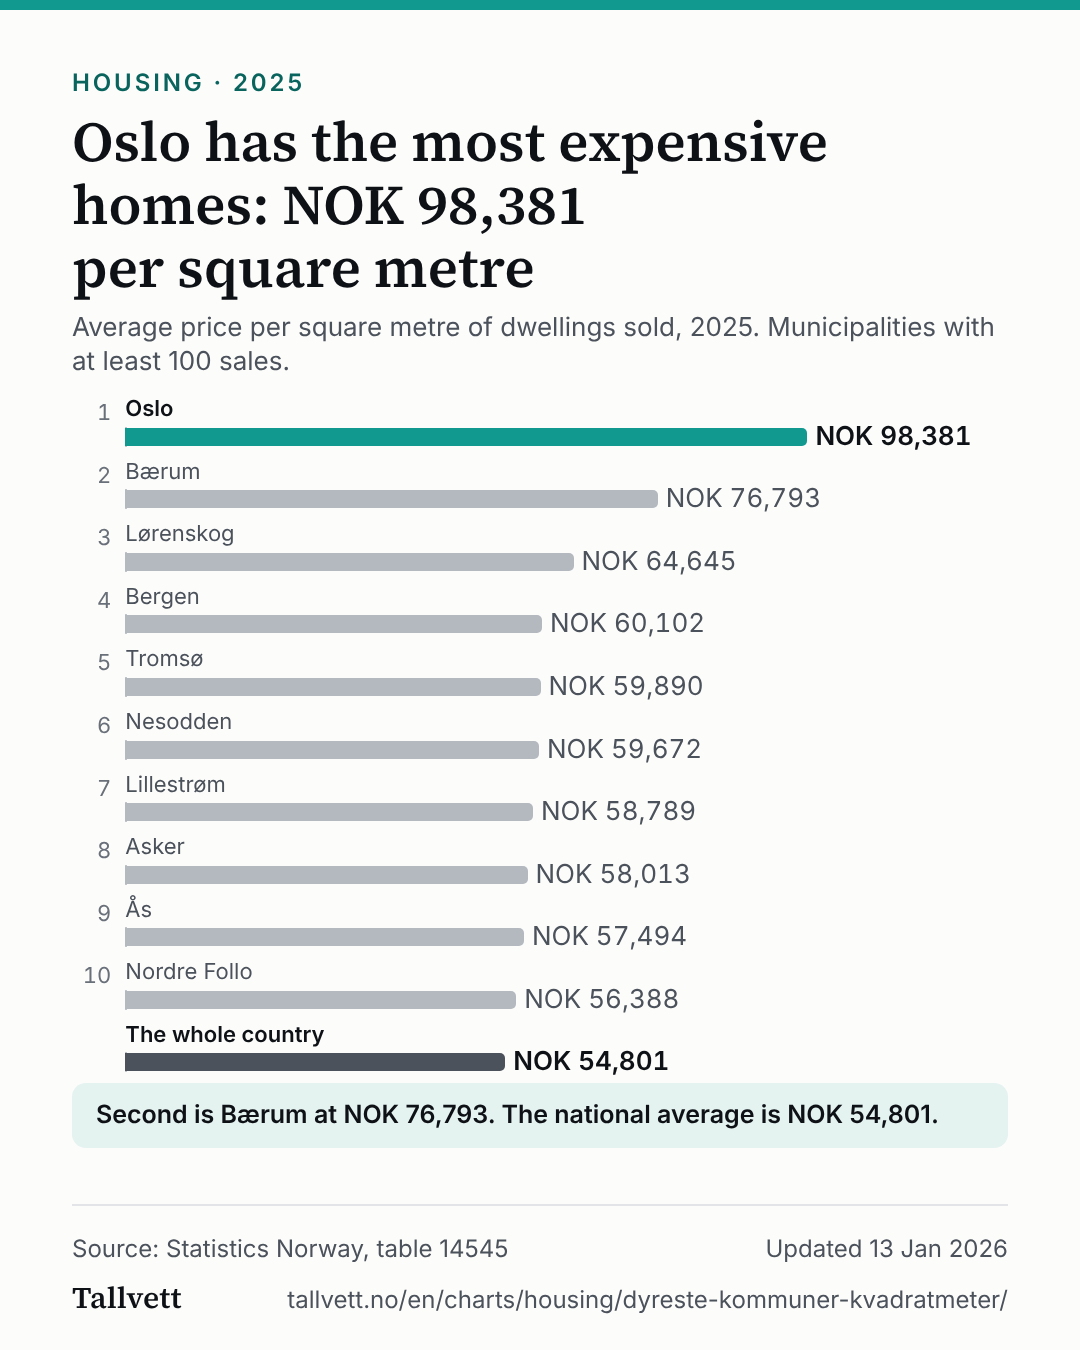
Oslo has the most expensive homes: NOK 98,381 per square metre
Average price per square metre of dwellings sold, 2025. Municipalities with at least 100 sales.
Ranked list of the ten municipalities with the most expensive homes in 2025, by average price per square metre. 1. Oslo: NOK 98,381; 2. Bærum: NOK 76,793; 3. Lørenskog: NOK 64,645; 4. Bergen: NOK 60,102; 5. Tromsø: NOK 59,890; 6. Nesodden: NOK 59,672; 7. Lillestrøm: NOK 58,789; 8. Asker: NOK 58,013; 9. Ås: NOK 57,494; 10. Nordre Follo: NOK 56,388; The whole country: NOK 54,801.
- OsloNOK 98,381
- BærumNOK 76,793
- LørenskogNOK 64,645
- BergenNOK 60,102
- TromsøNOK 59,890
- NesoddenNOK 59,672
- LillestrømNOK 58,789
- AskerNOK 58,013
- ÅsNOK 57,494
- Nordre FolloNOK 56,388
- The whole countryNOK 54,801
Second is Bærum at NOK 76,793. The national average is NOK 54,801.
Show the figures as a table
| Municipality | Price per square metre |
|---|---|
| 1. Oslo | NOK 98,381 |
| 2. Bærum | NOK 76,793 |
| 3. Lørenskog | NOK 64,645 |
| 4. Bergen | NOK 60,102 |
| 5. Tromsø | NOK 59,890 |
| 6. Nesodden | NOK 59,672 |
| 7. Lillestrøm | NOK 58,789 |
| 8. Asker | NOK 58,013 |
| 9. Ås | NOK 57,494 |
| 10. Nordre Follo | NOK 56,388 |
| The whole country | NOK 54,801 |
How this chart was made
- The figures are Statistics Norway's own, from table 14545: the average price per square metre of all types of dwellings sold during the year. We have not calculated them.
- We chose the ten municipalities with the highest price, among municipalities with at least 100 sales in the year. Fewer sales give an average that swings a lot from year to year.
- The price is for all dwelling types together. Municipalities with two official names appear under the first, for example Oslo for “Oslo - Oslove”.
Statistics Norway's notes on the table
- Price is per square meter usable floor area within the enclosing walls of the dwelling unit. Exact definition can be found in NS 3940:2023.
- .. = Data not available. Figures have not been entered into our databases or are too unreliable to be published.
- . = Category not applicable. Figures do not exist at this time, because the category was not in use when the figures were collected.