17 out of 100 residents are 67 or older
17 out of 100 residents are 67 or older
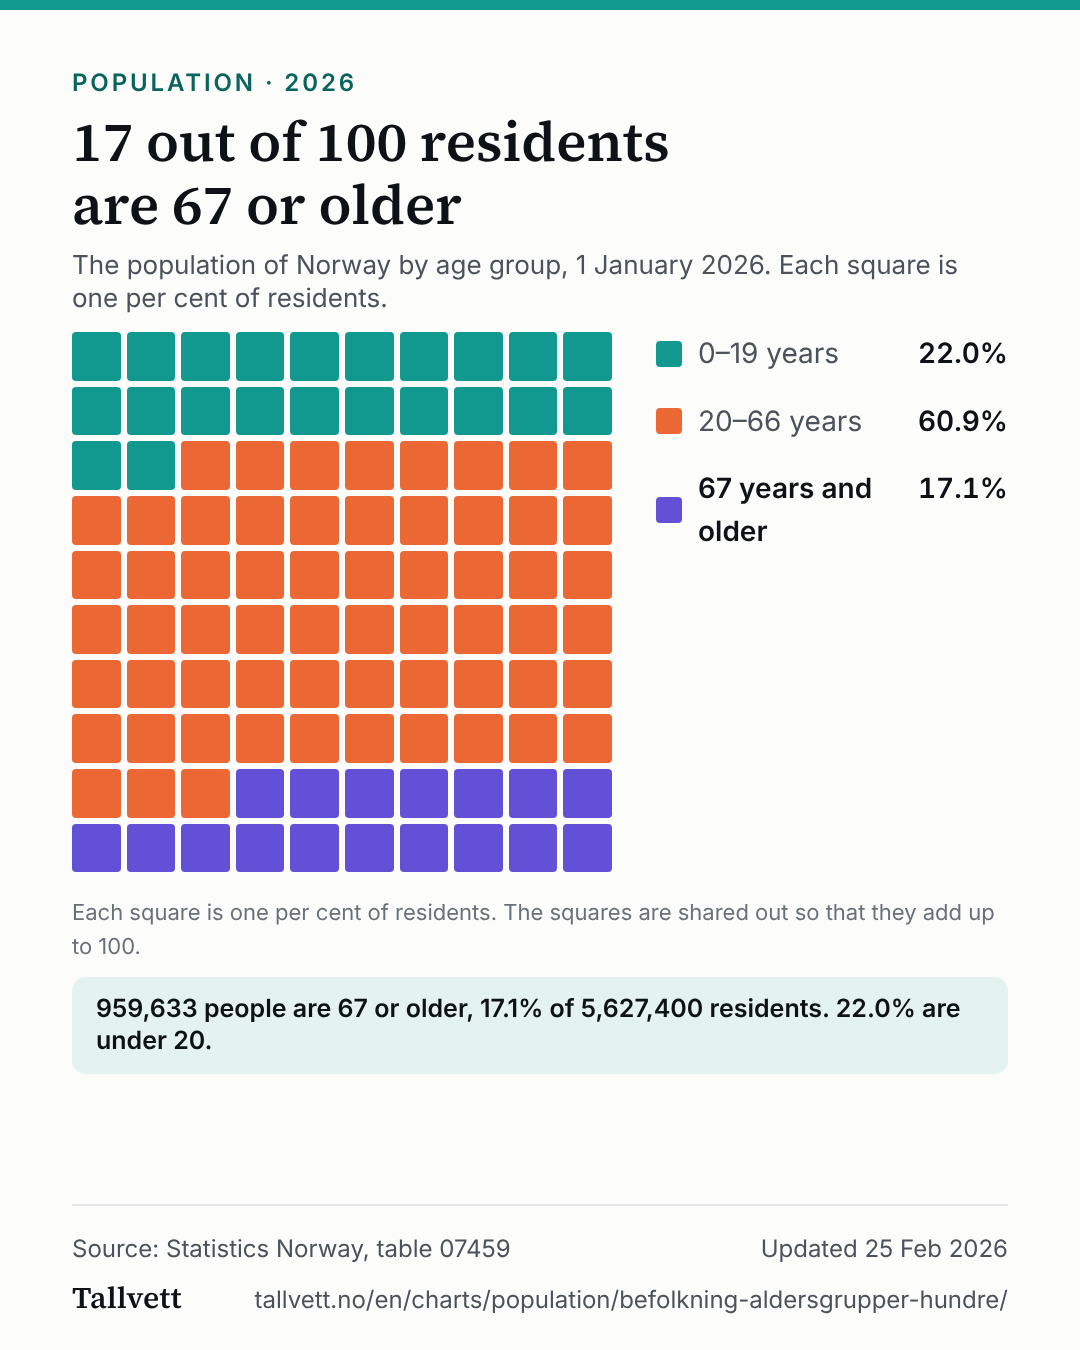
The population of Norway by age group, 1 January 2026. Each square is one per cent of residents.
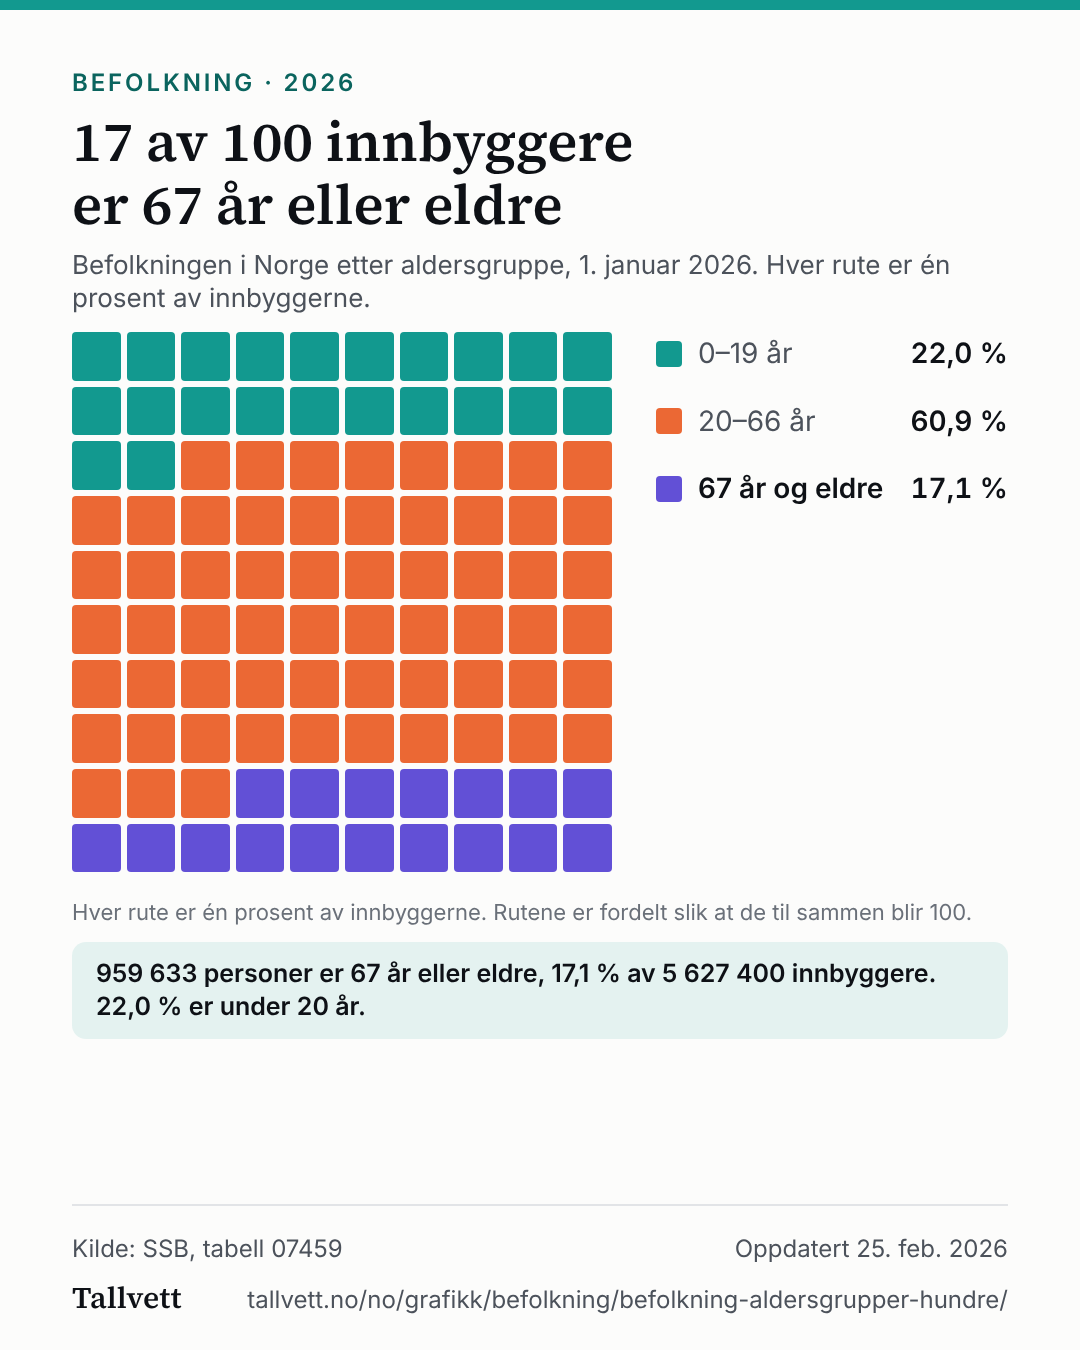
One hundred squares showing how the population of Norway divides into age groups on 1 January 2026. 0–19 years: 1,238,634 (22.0%); 20–66 years: 3,429,133 (60.9%); 67 years and older: 959,633 (17.1%).
- 0–19 years22.0%
- 20–66 years60.9%
- 67 years and older17.1%
Each square is one per cent of residents. The squares are shared out so that they add up to 100.
959,633 people are 67 or older, 17.1% of 5,627,400 residents. 22.0% are under 20.
Show the figures as a table
| Age group | People | Share |
|---|---|---|
| 0–19 years | 1,238,634 | 22.0% |
| 20–66 years | 3,429,133 | 60.9% |
| 67 years and older | 959,633 | 17.1% |
How this chart was made
- The figures are Statistics Norway's own, from table 07459: number of persons by year of age, women and men, whole country, 1 January. We added women and men and every year of age within each group.
- The age groups are our choice, not Statistics Norway's: 0–19, 20–66 and 67 and older. The share is the number of people in the group divided by all residents.
- The squares are shared out by the largest remainder rule: each group gets the whole squares it is owed, and the squares left over go to the groups with the largest remainders. The total is then always 100, which ordinary rounding does not guarantee. The number in the headline is the number of squares for the oldest group.
Statistics Norway's notes on the table
- Expired municipalities in the period 1986-2013 are not included in the table that distributes people in Police districts 2016. The figures for several of the Police districts 2016 are therefore not complete for this period.
More charts about population
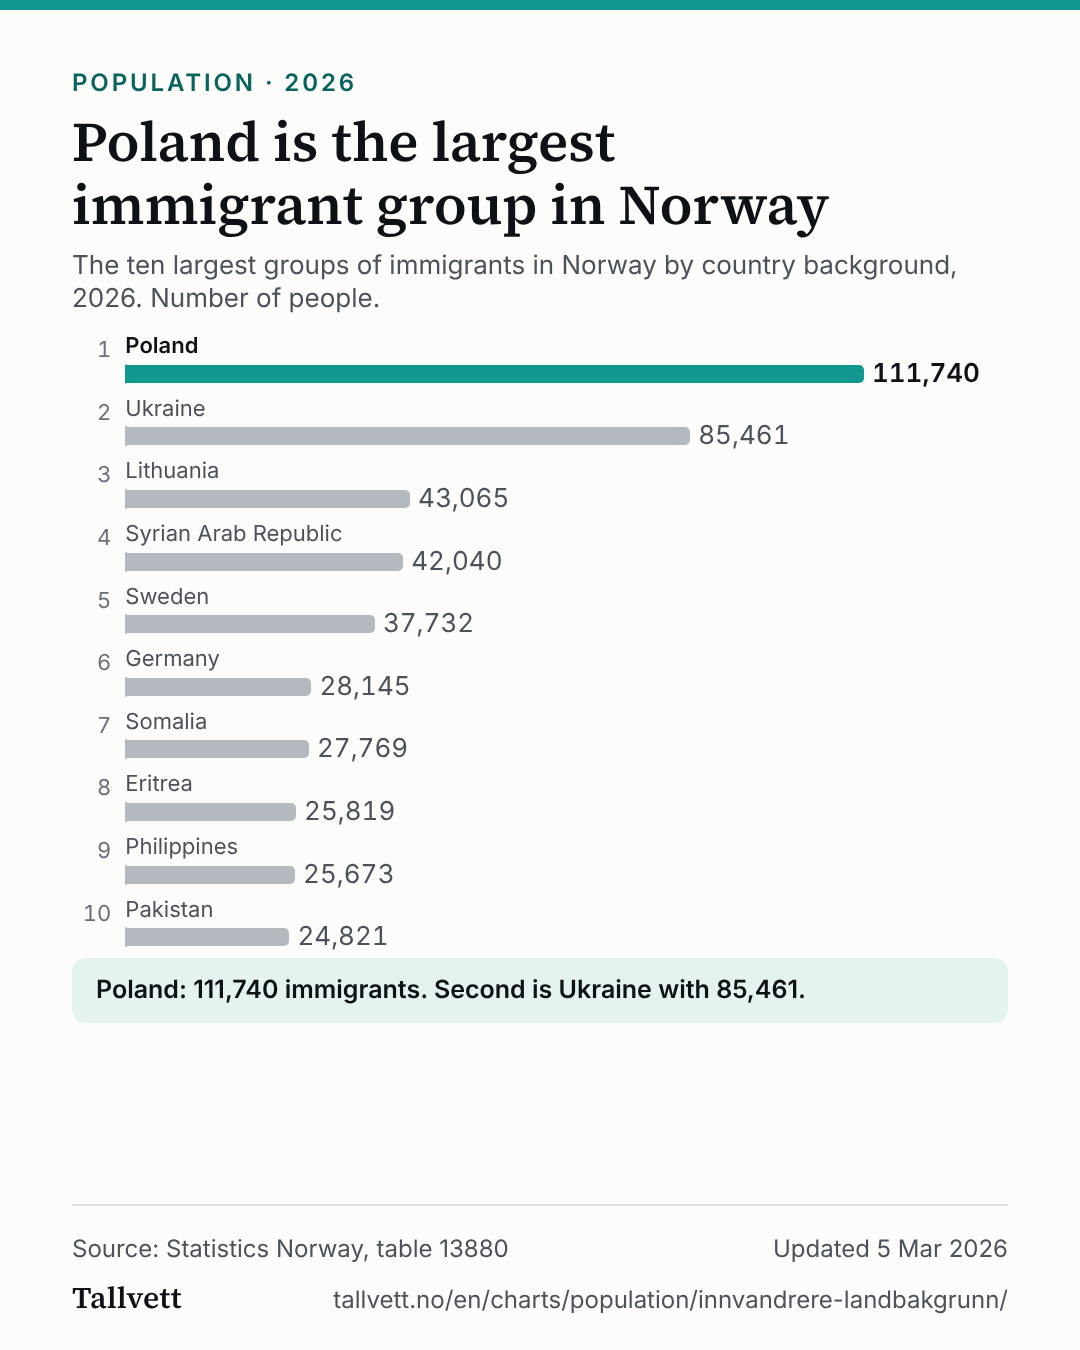 Poland is the largest immigrant group in Norway
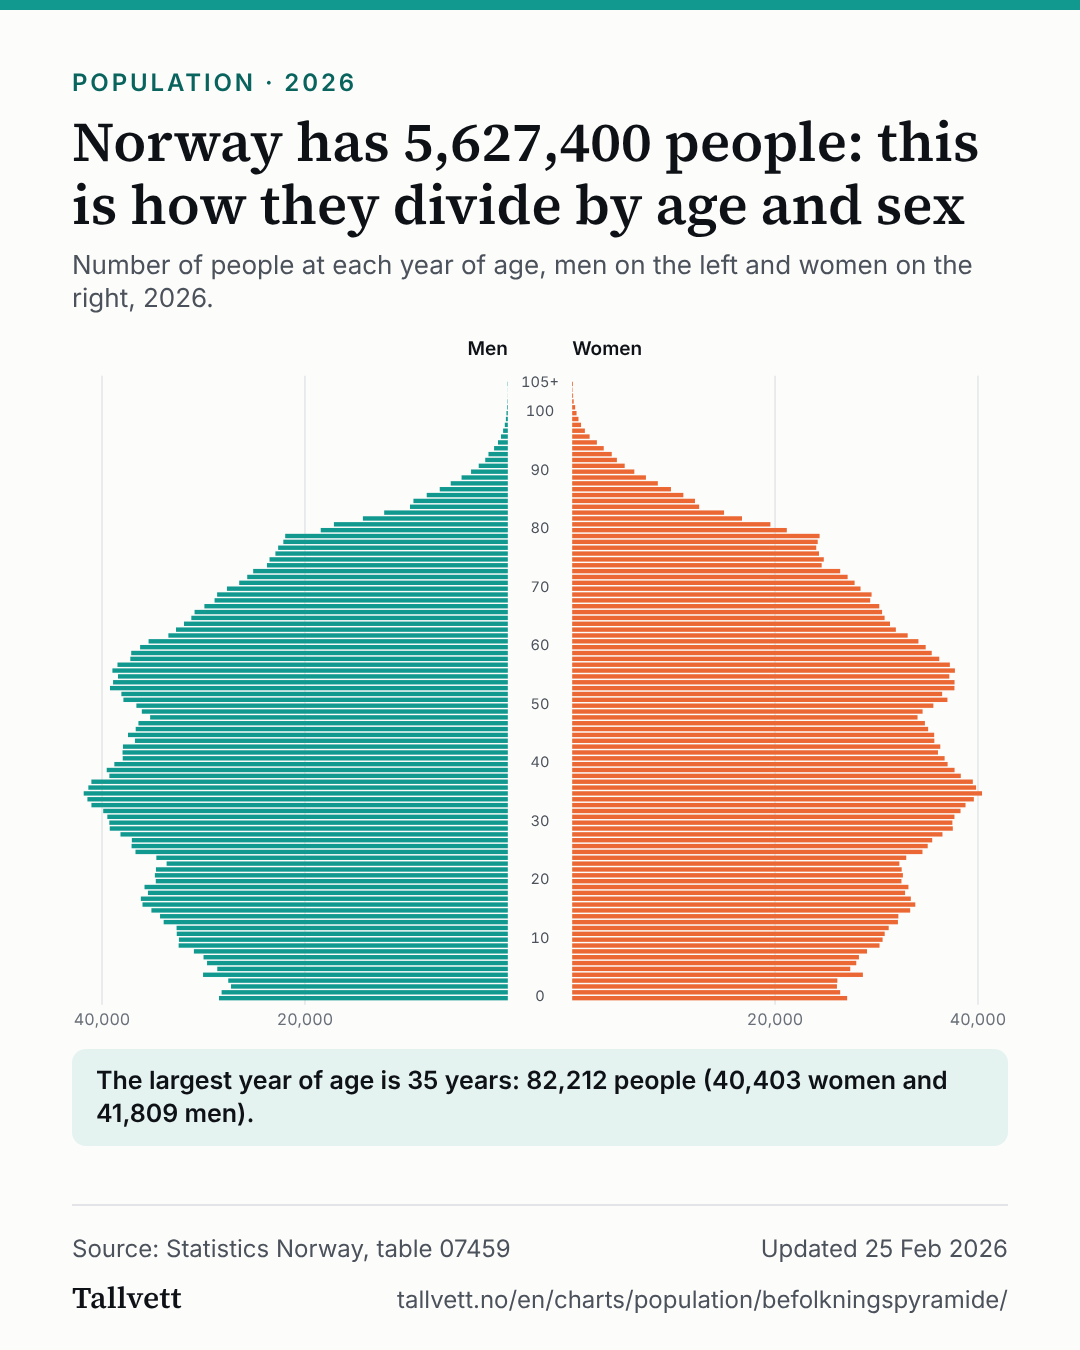 Norway has 5,627,400 people: this is how they divide by age and sex
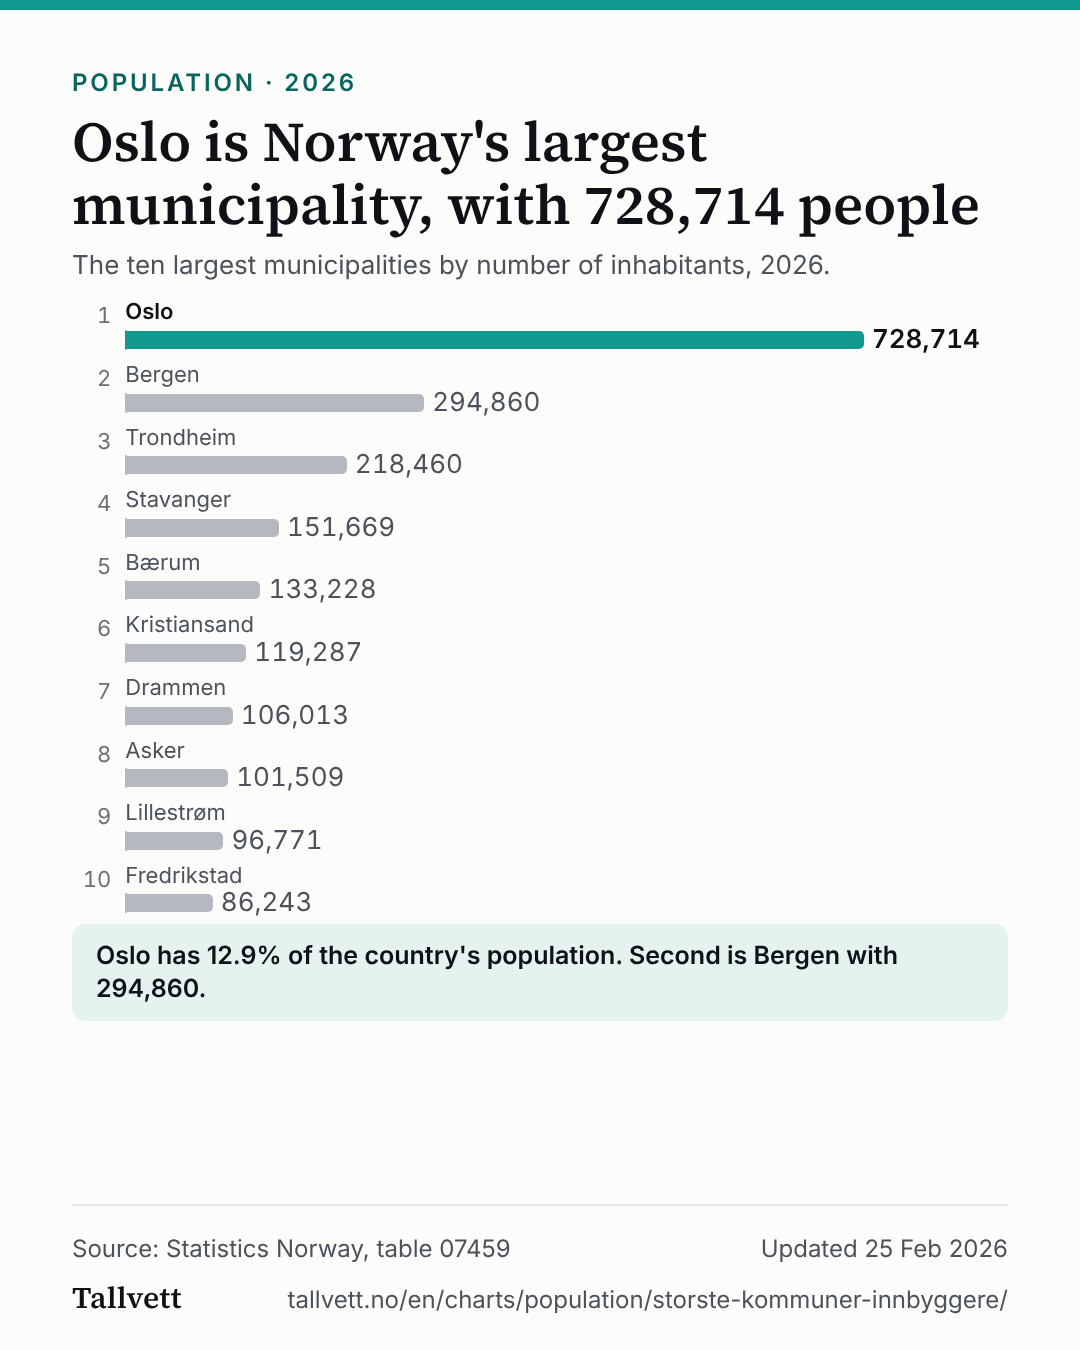 Oslo is Norway's largest municipality, with 728,714 people
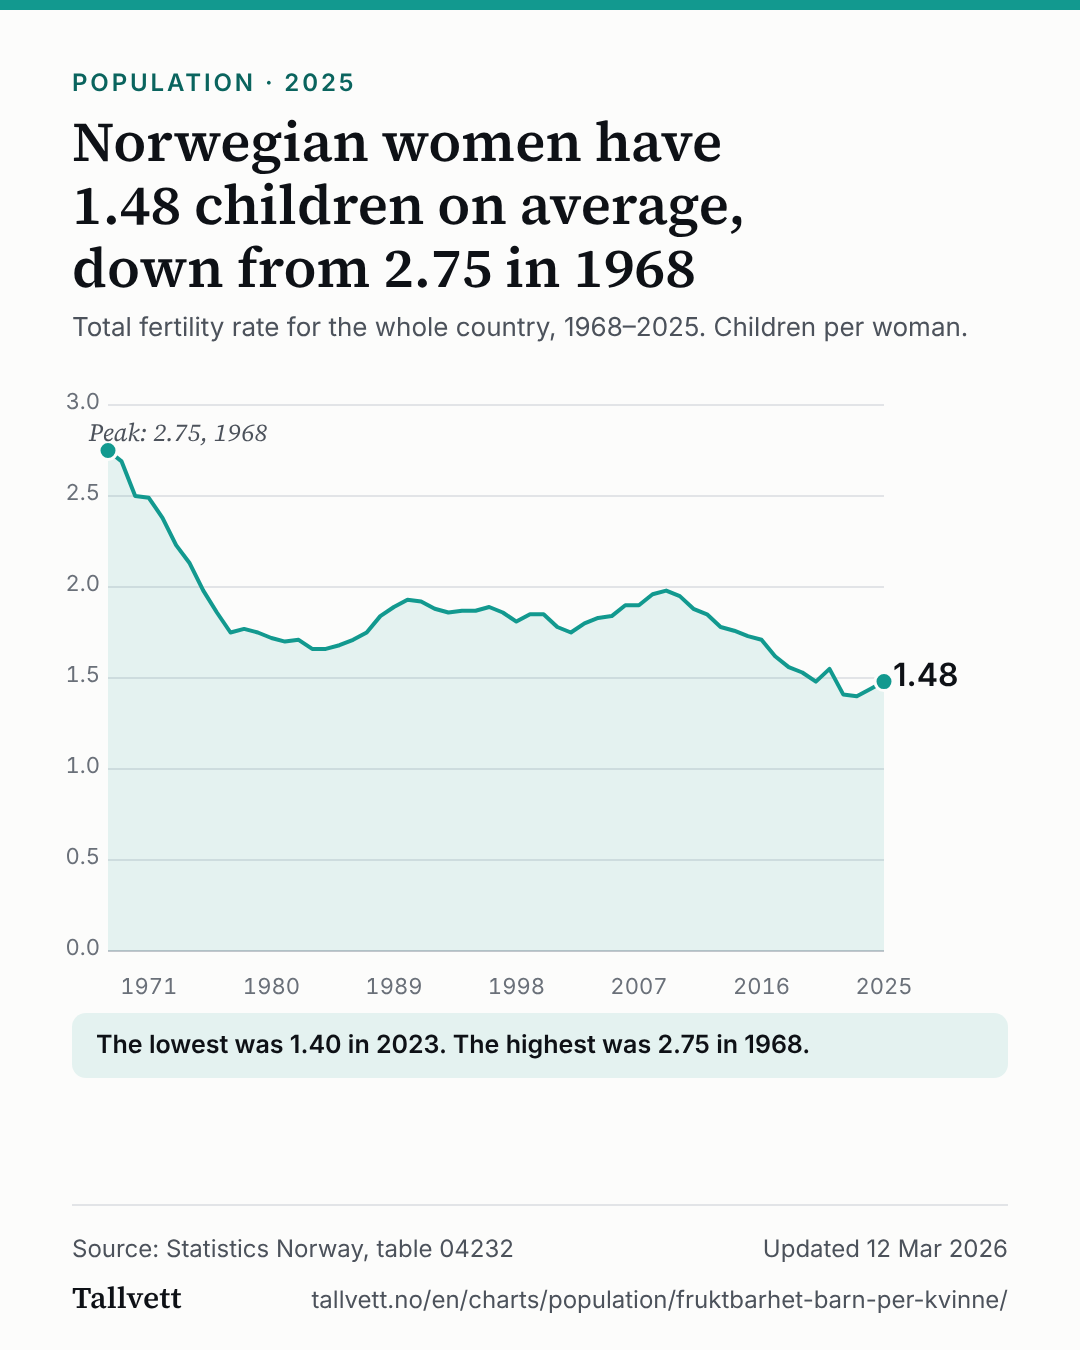 Norwegian women have 1.48 children on average, down from 2.75 in 1968
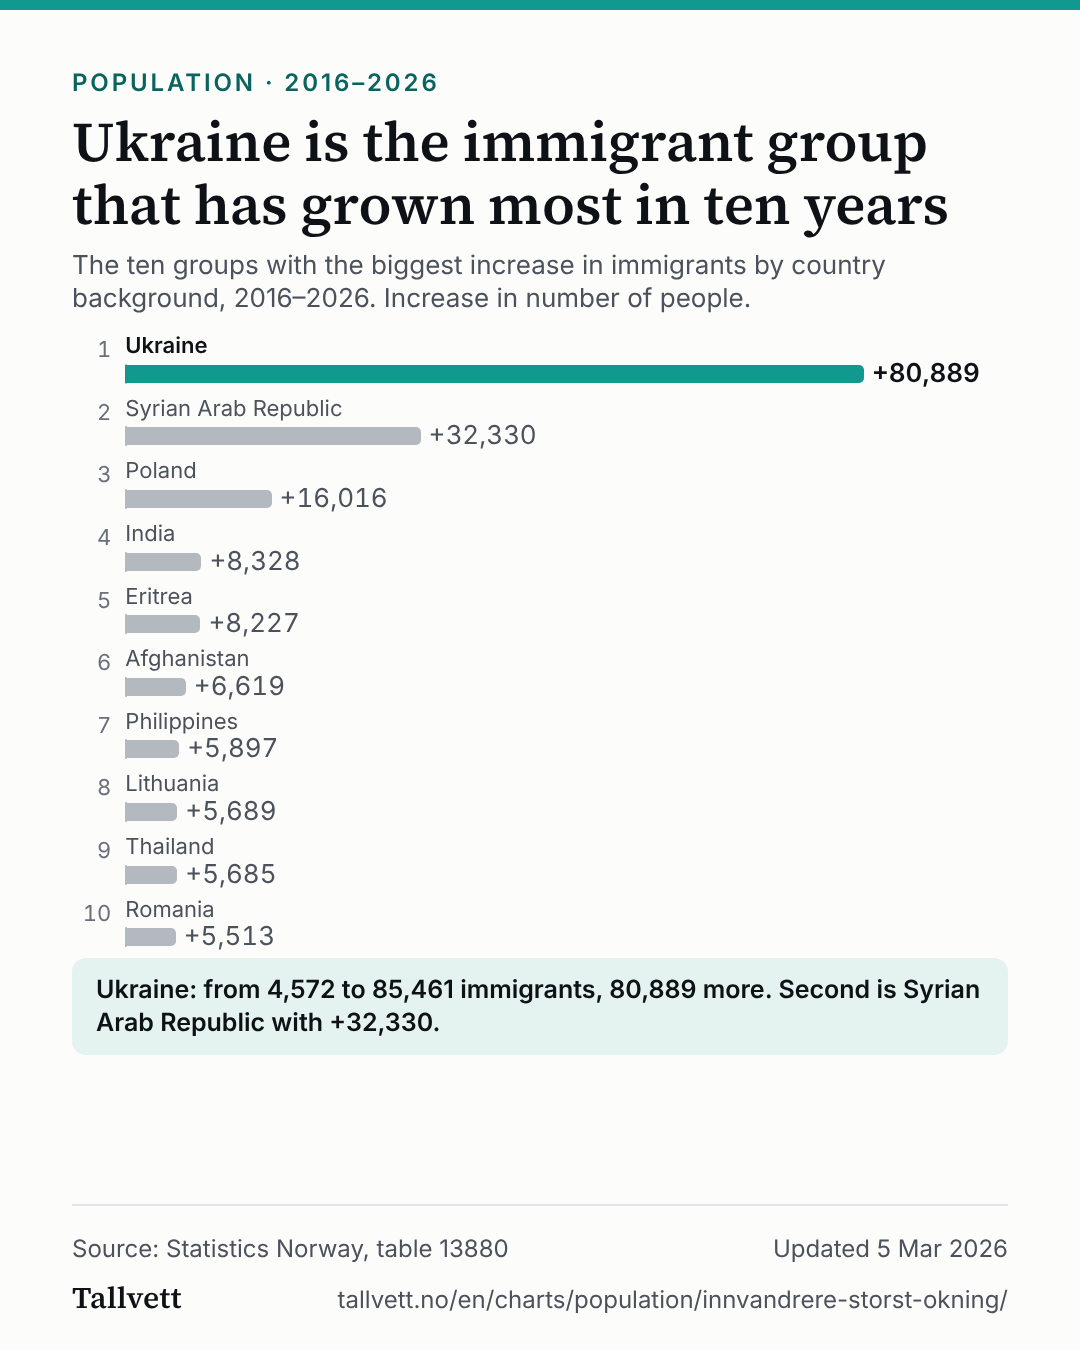 Ukraine is the immigrant group that has grown most in ten years
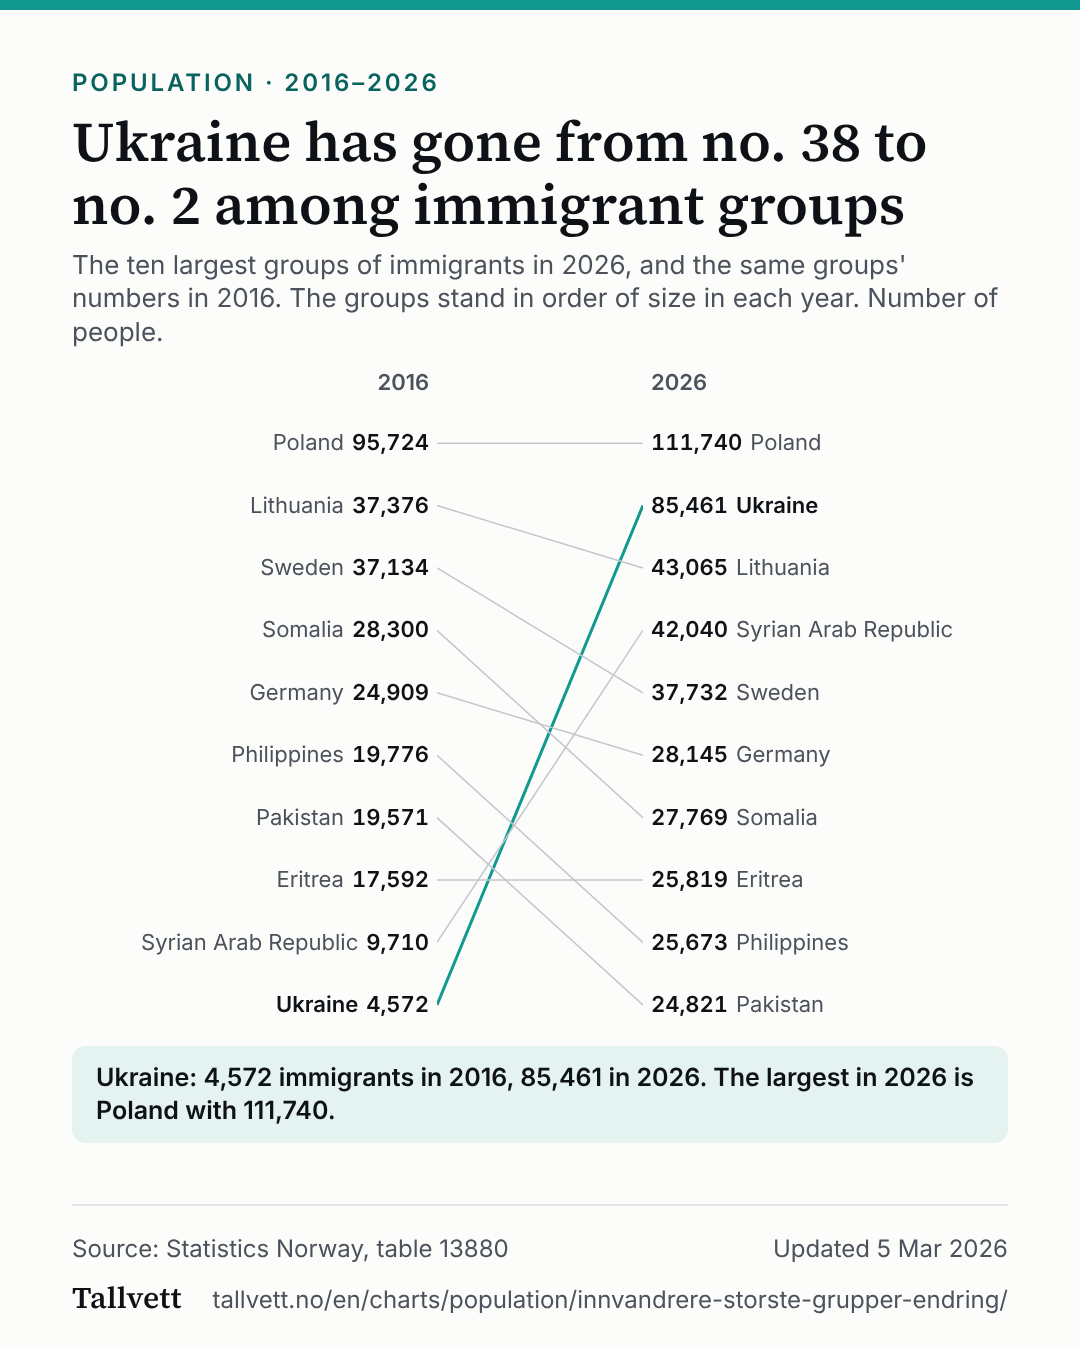 Ukraine has gone from no. 38 to no. 2 among immigrant groups
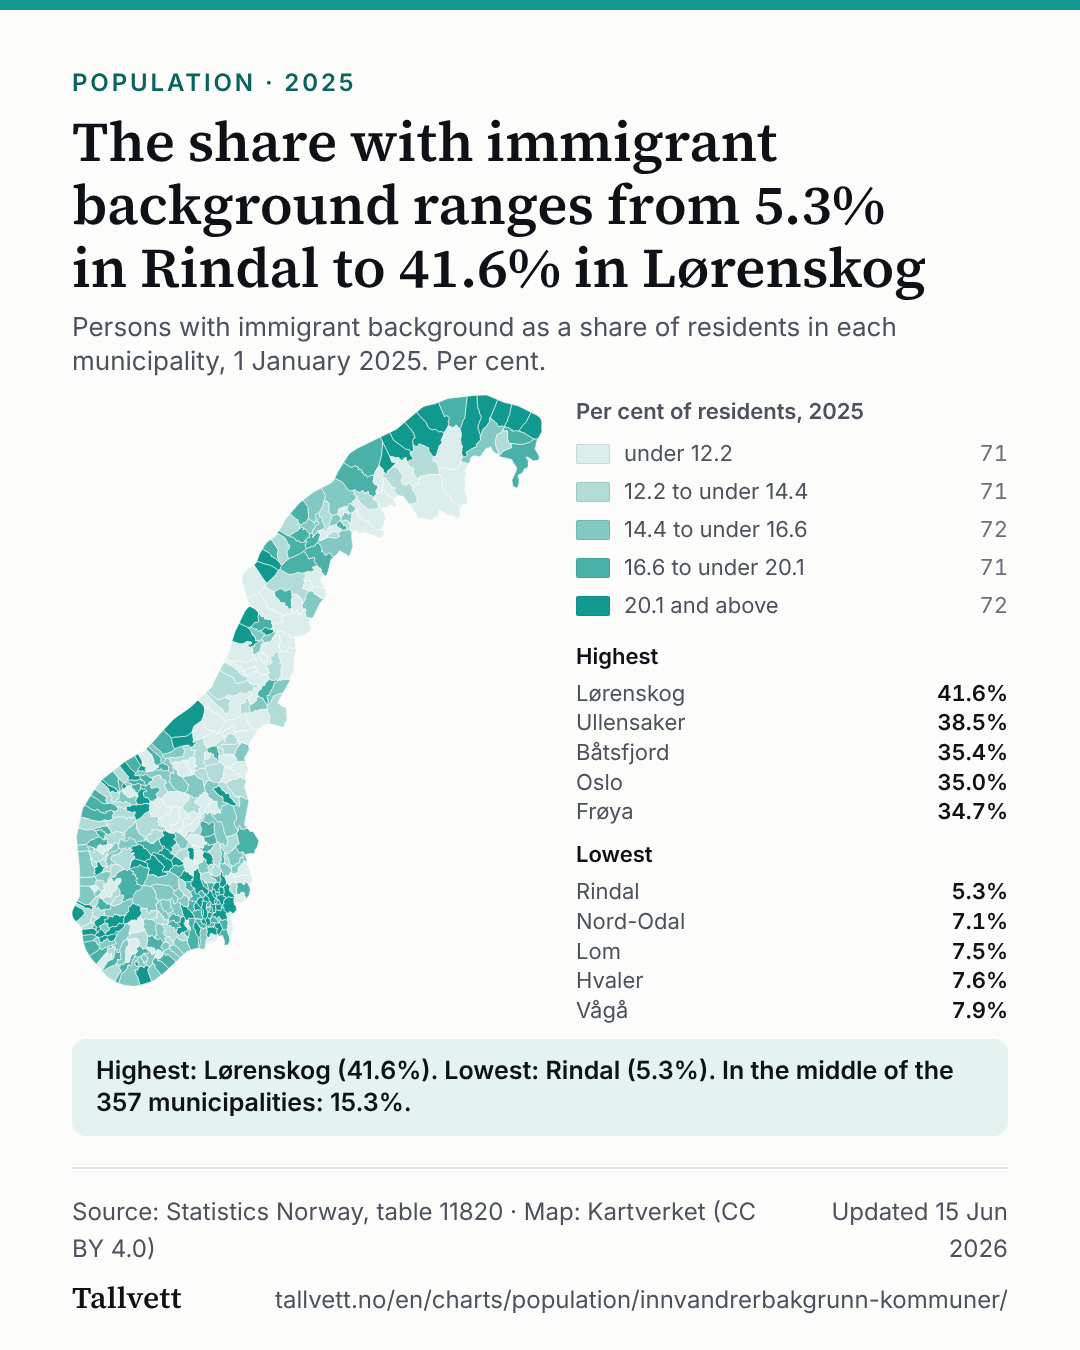 The share with immigrant background ranges from 5.3% in Rindal to 41.6% in Lørenskog
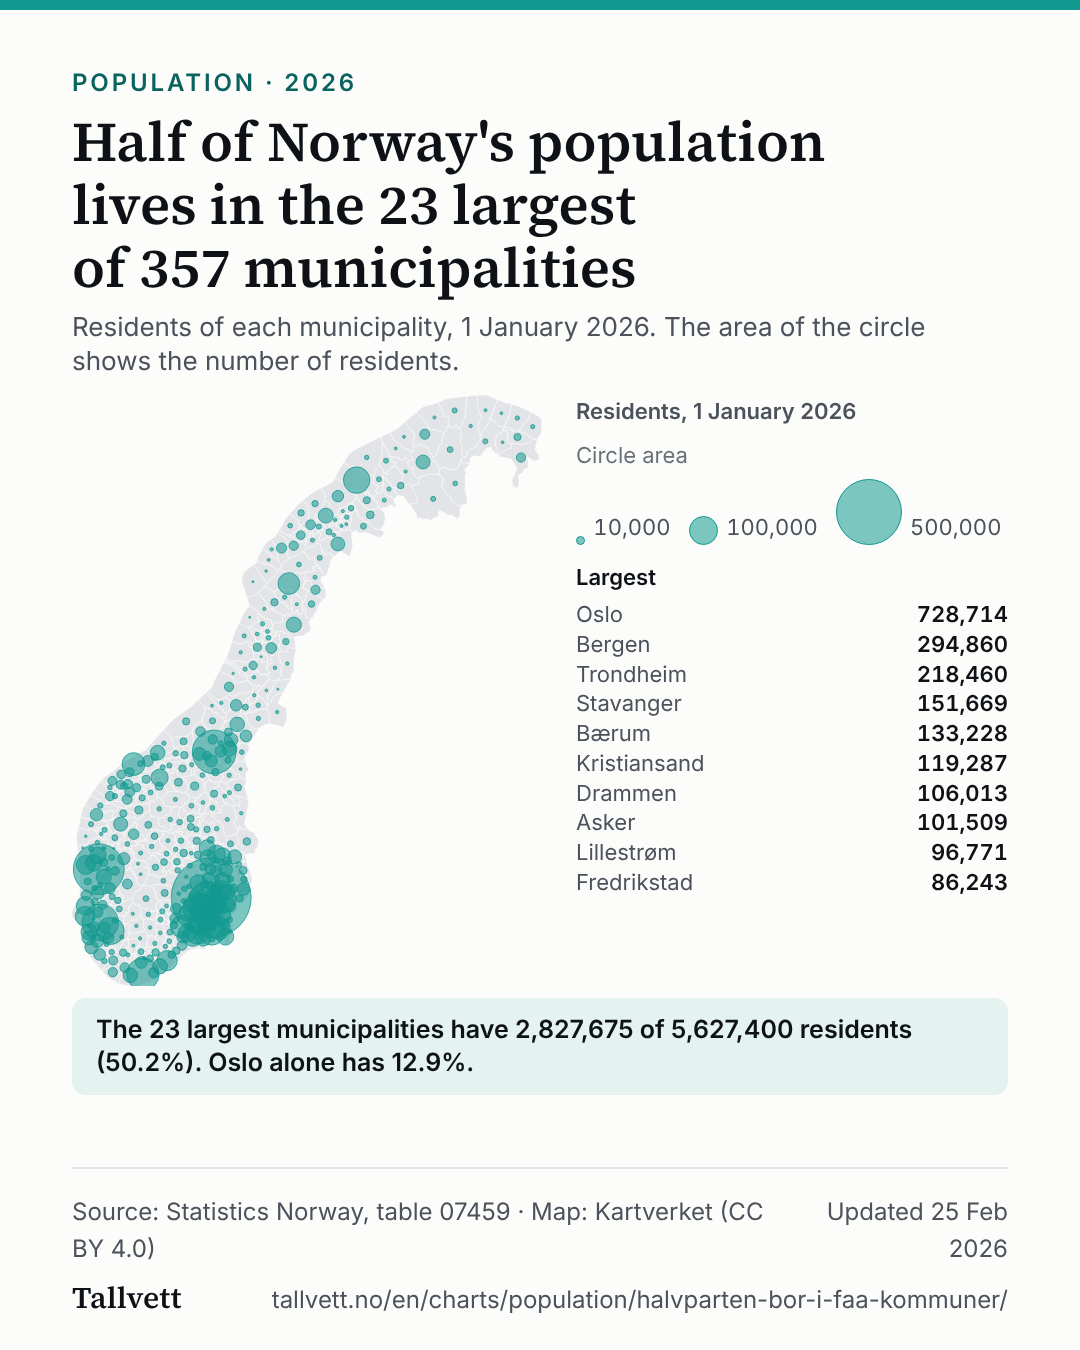 Half of Norway's population lives in the 23 largest of 357 municipalities