Ukraine is the immigrant group that has grown most in ten years
Ukraine is the immigrant group that has grown most in ten years
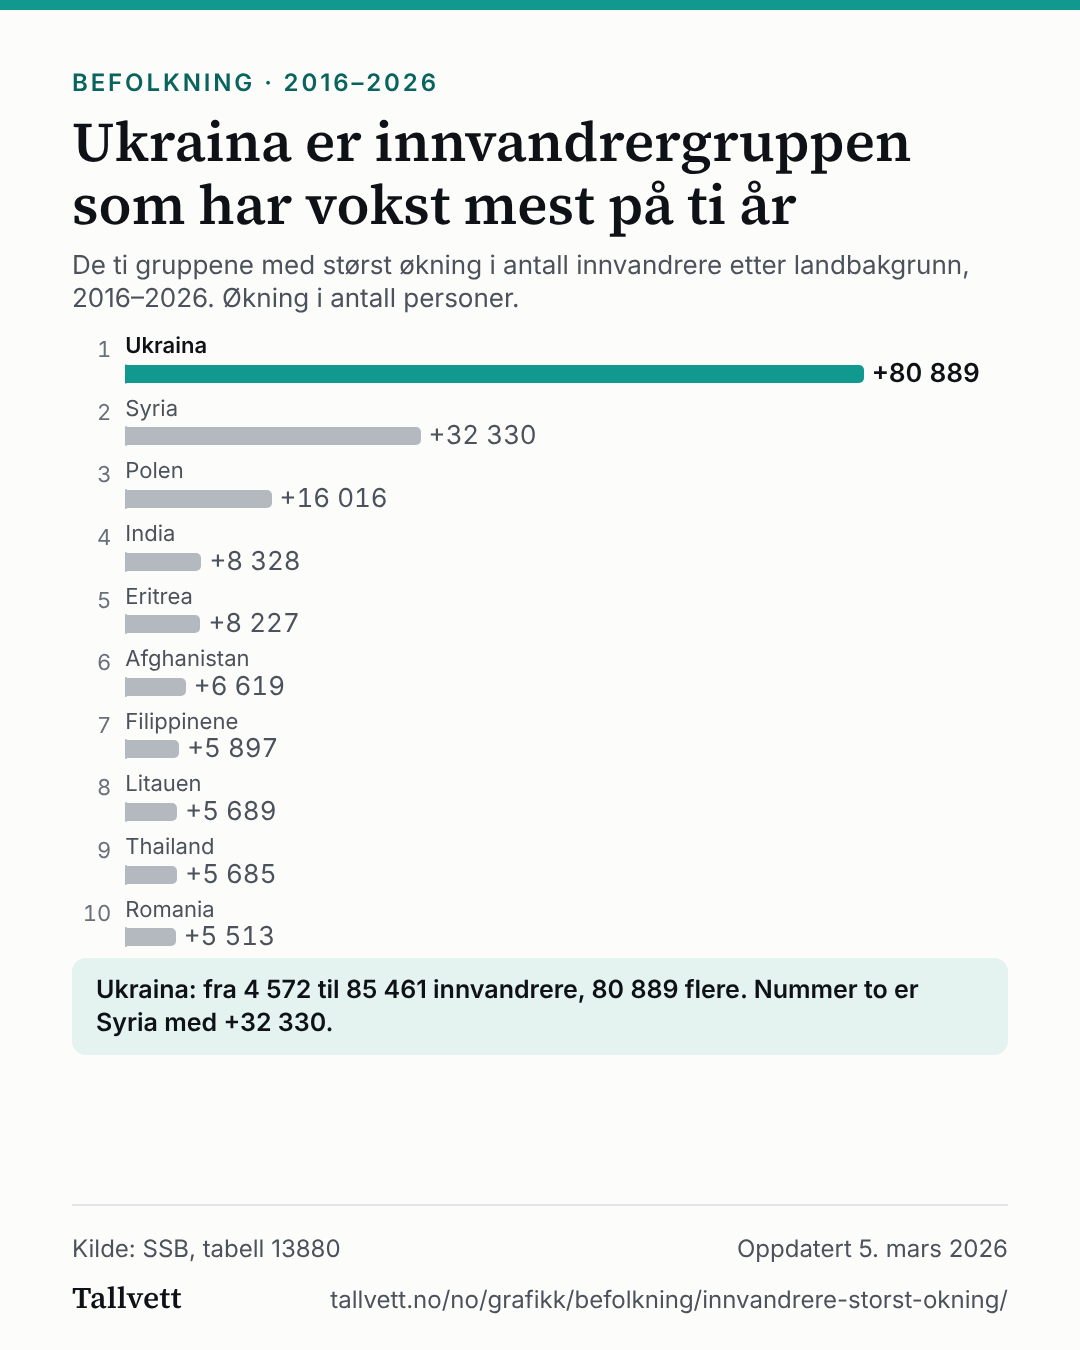
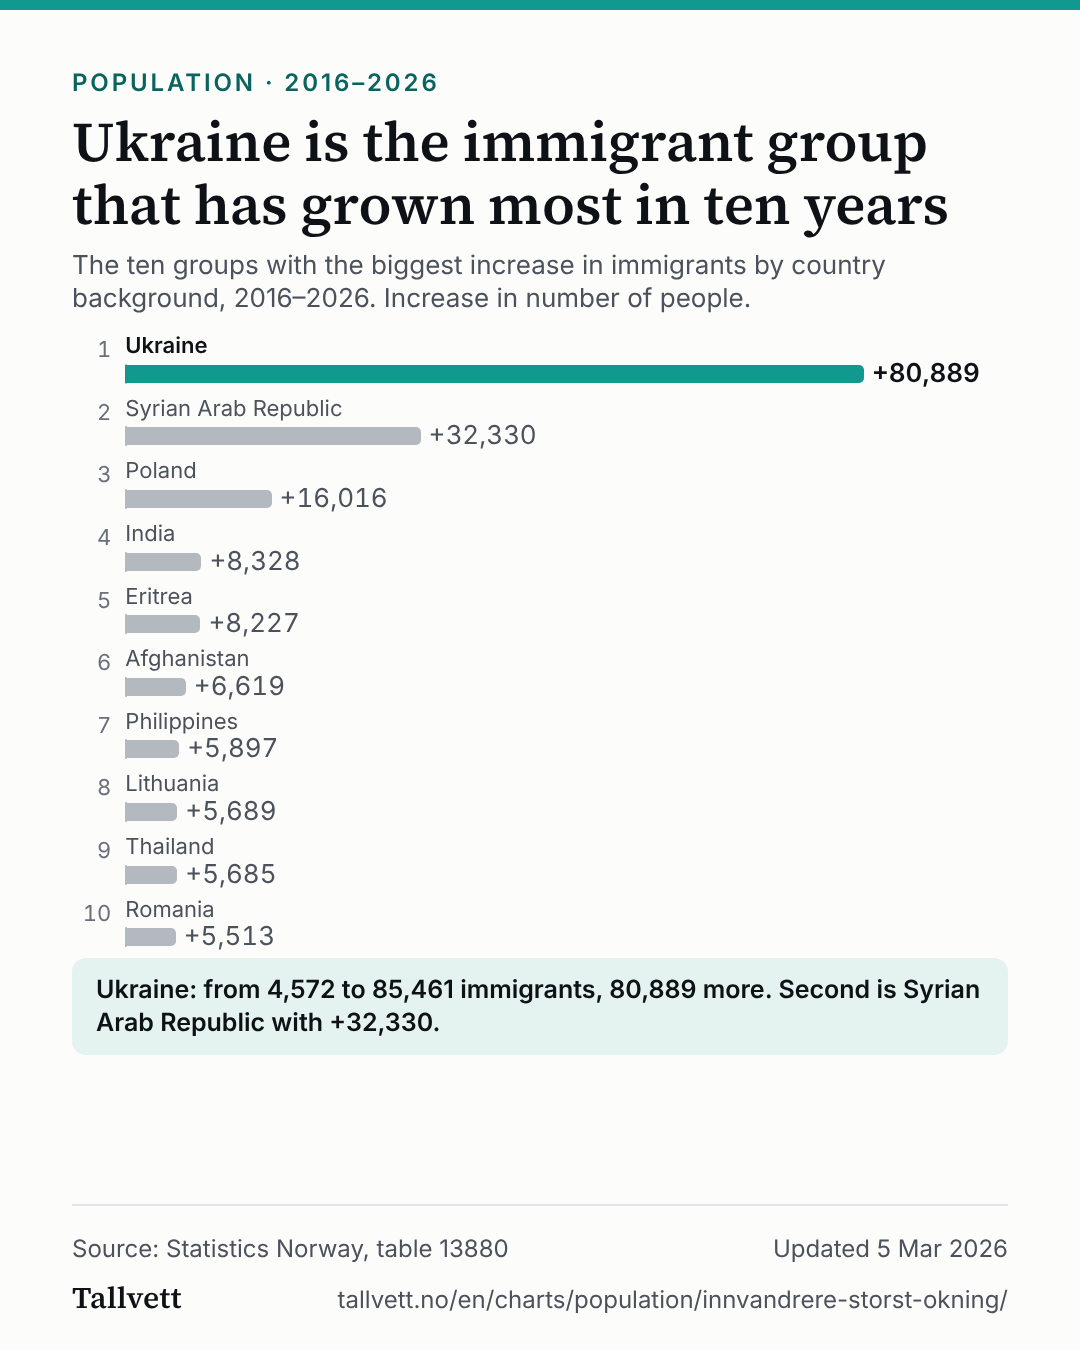
The ten groups with the biggest increase in immigrants by country background, 2016–2026. Increase in number of people.
Ranked list of the ten groups of immigrants in Norway that have increased most in number from 2016 to 2026. 1. Ukraine: +80,889; 2. Syrian Arab Republic: +32,330; 3. Poland: +16,016; 4. India: +8,328; 5. Eritrea: +8,227; 6. Afghanistan: +6,619; 7. Philippines: +5,897; 8. Lithuania: +5,689; 9. Thailand: +5,685; 10. Romania: +5,513.
- Ukraine+80,889
- Syrian Arab Republic+32,330
- Poland+16,016
- India+8,328
- Eritrea+8,227
- Afghanistan+6,619
- Philippines+5,897
- Lithuania+5,689
- Thailand+5,685
- Romania+5,513
Ukraine: from 4,572 to 85,461 immigrants, 80,889 more. Second is Syrian Arab Republic with +32,330.
Show the figures as a table
| Country background | Immigrants 2016 | Immigrants 2026 | Increase |
|---|---|---|---|
| 1. Ukraine | 4,572 | 85,461 | +80,889 |
| 2. Syrian Arab Republic | 9,710 | 42,040 | +32,330 |
| 3. Poland | 95,724 | 111,740 | +16,016 |
| 4. India | 10,954 | 19,282 | +8,328 |
| 5. Eritrea | 17,592 | 25,819 | +8,227 |
| 6. Afghanistan | 14,233 | 20,852 | +6,619 |
| 7. Philippines | 19,776 | 25,673 | +5,897 |
| 8. Lithuania | 37,376 | 43,065 | +5,689 |
| 9. Thailand | 17,518 | 23,203 | +5,685 |
| 10. Romania | 13,380 | 18,893 | +5,513 |
How this chart was made
- The figures are Statistics Norway's own, from table 13880: resident immigrants on 1 January by country background. The increase we calculated: the number in 2026 minus the number in 2016.
- The groups are ranked by the increase in people, not in per cent. A small group can grow by a large percentage and still add few people.
- The figures count residents on 1 January, not how many arrived during the year. Immigrants are people born abroad to two foreign-born parents who themselves immigrated to Norway; country background is the country the immigrant was born in. This is Statistics Norway's definition.
- The table shows how much each group has grown, not why. Small numbers (one and two) are changed to 0 or 3 to protect privacy. Countries without a figure in both years are not included.
Statistics Norway's notes on the table
- All one and two digits have been changed to 0 or 3 for each country separately to protect privacy. When the figures are aggregated to parts of the world and country groups, the total may therefore deviate somewhat from the actual figures.
More charts about population
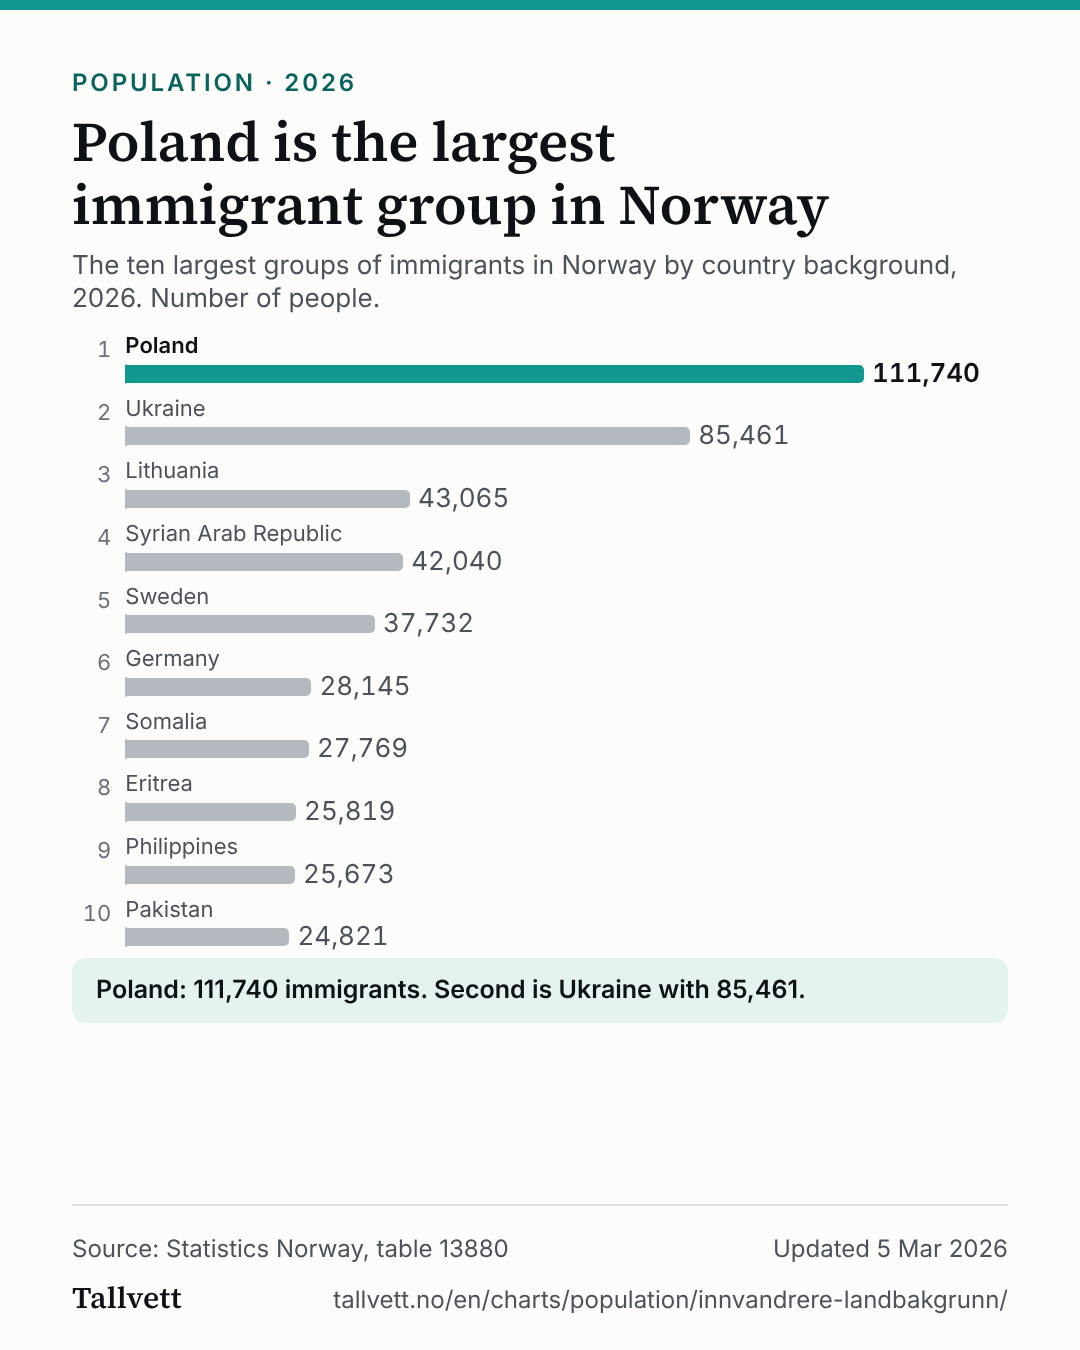 Poland is the largest immigrant group in Norway
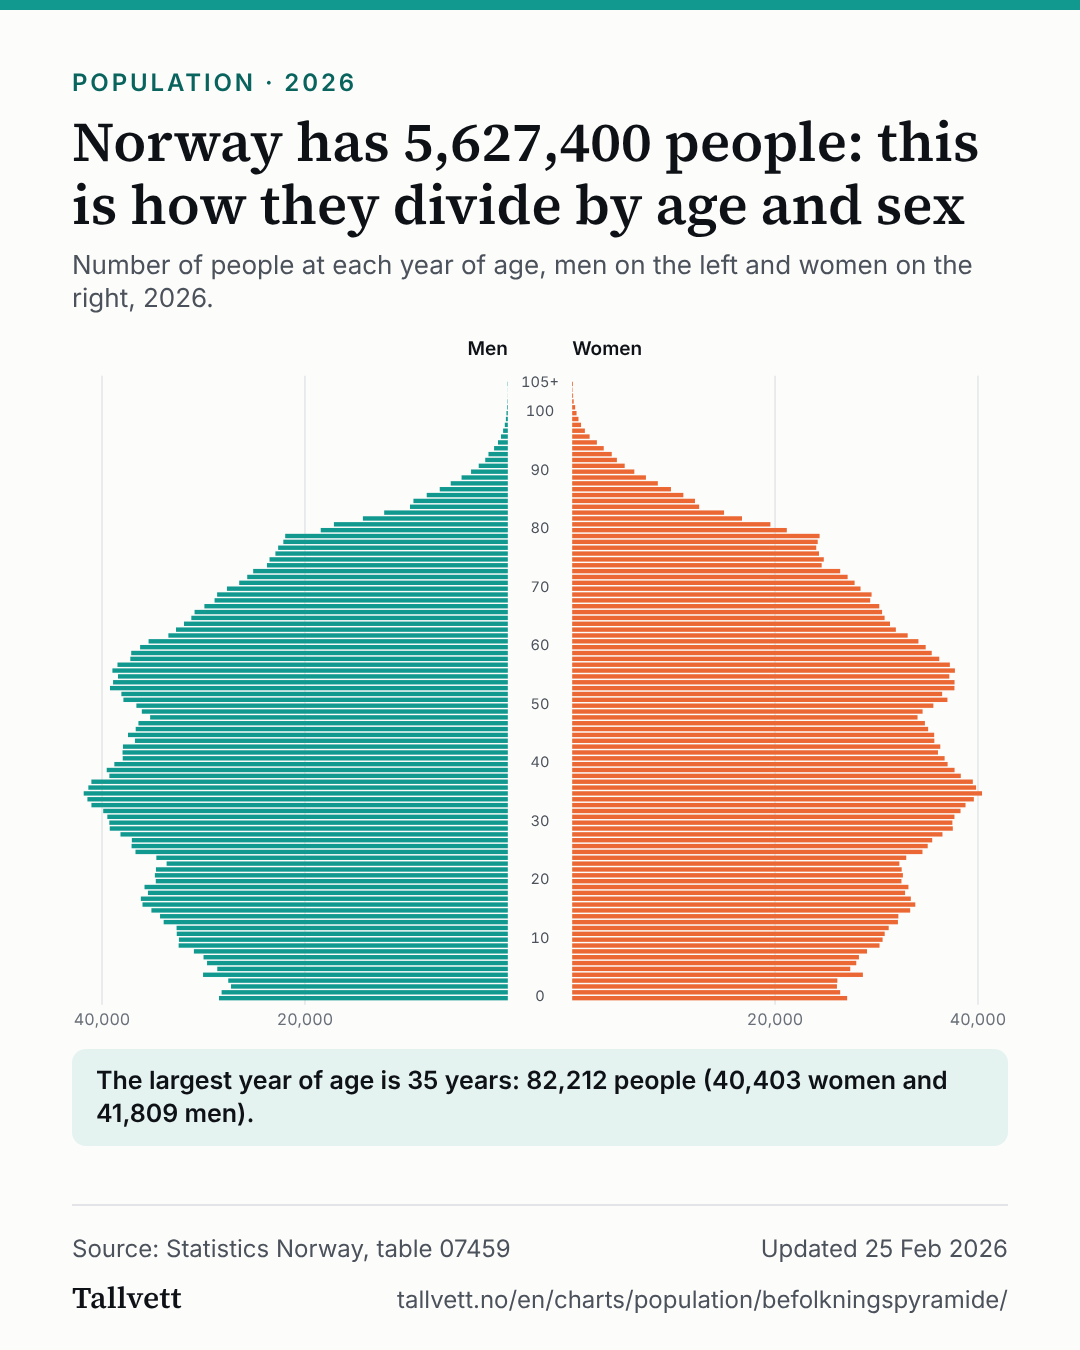 Norway has 5,627,400 people: this is how they divide by age and sex
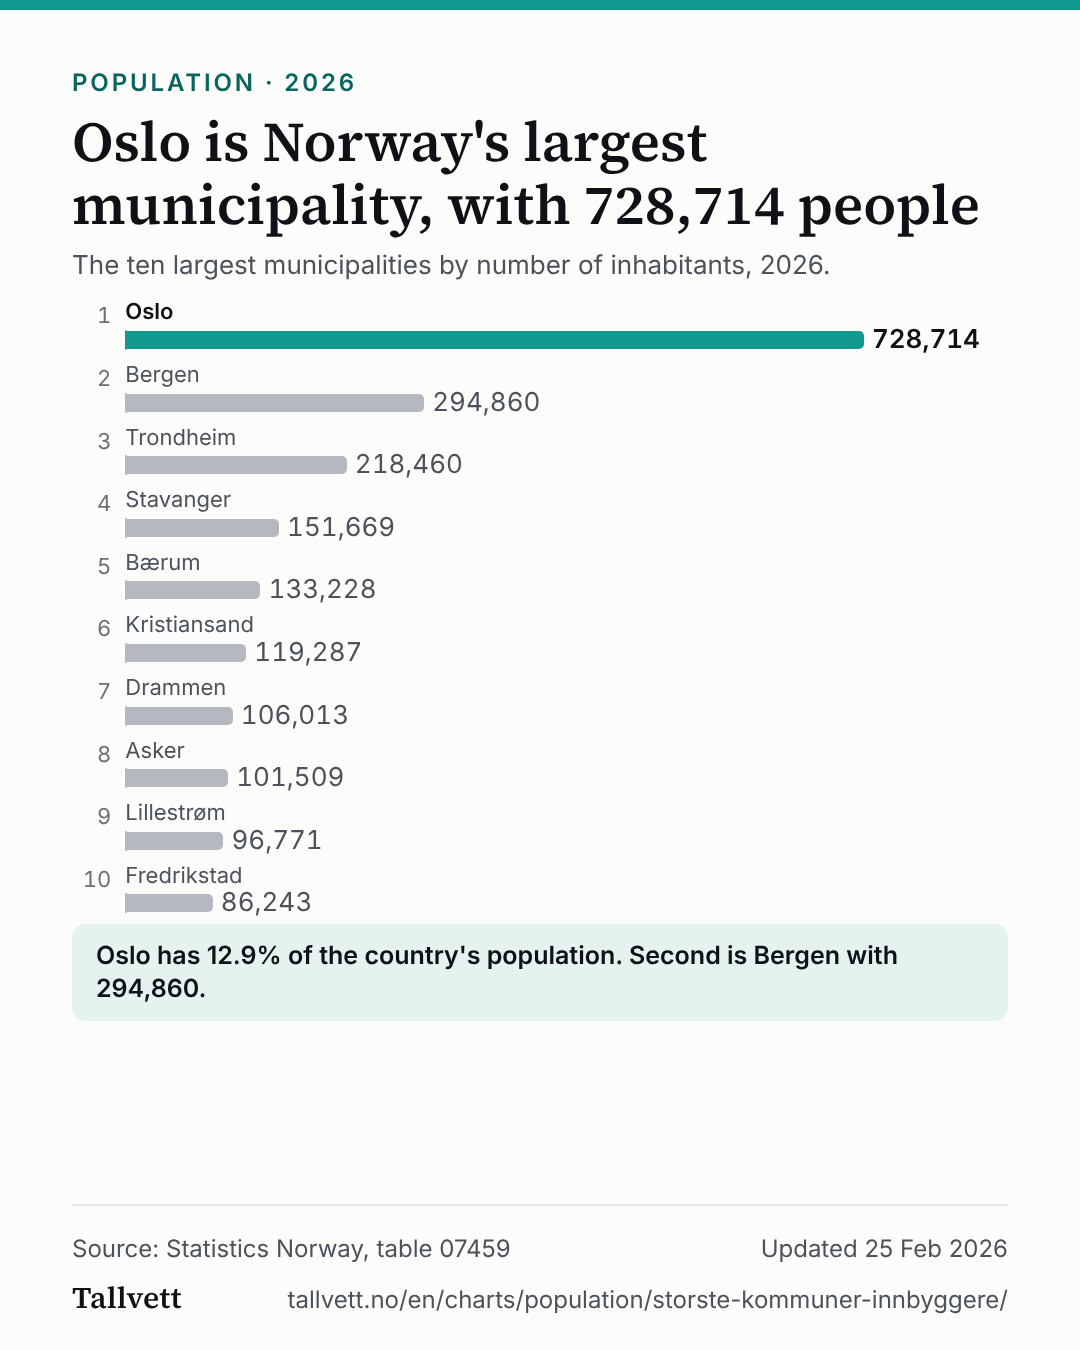 Oslo is Norway's largest municipality, with 728,714 people
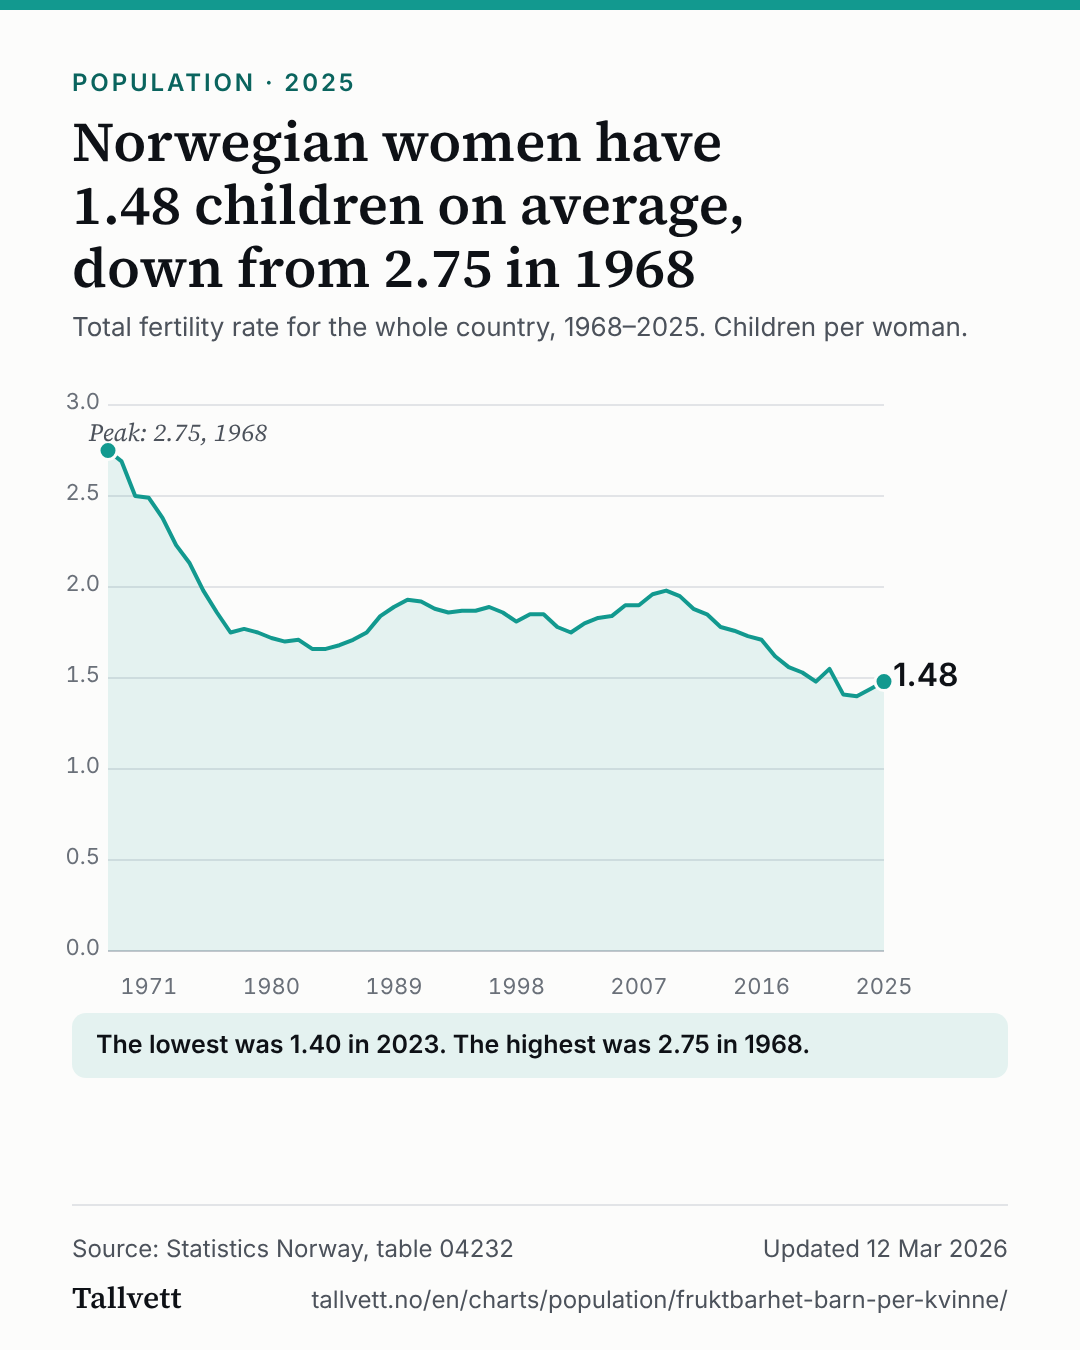 Norwegian women have 1.48 children on average, down from 2.75 in 1968
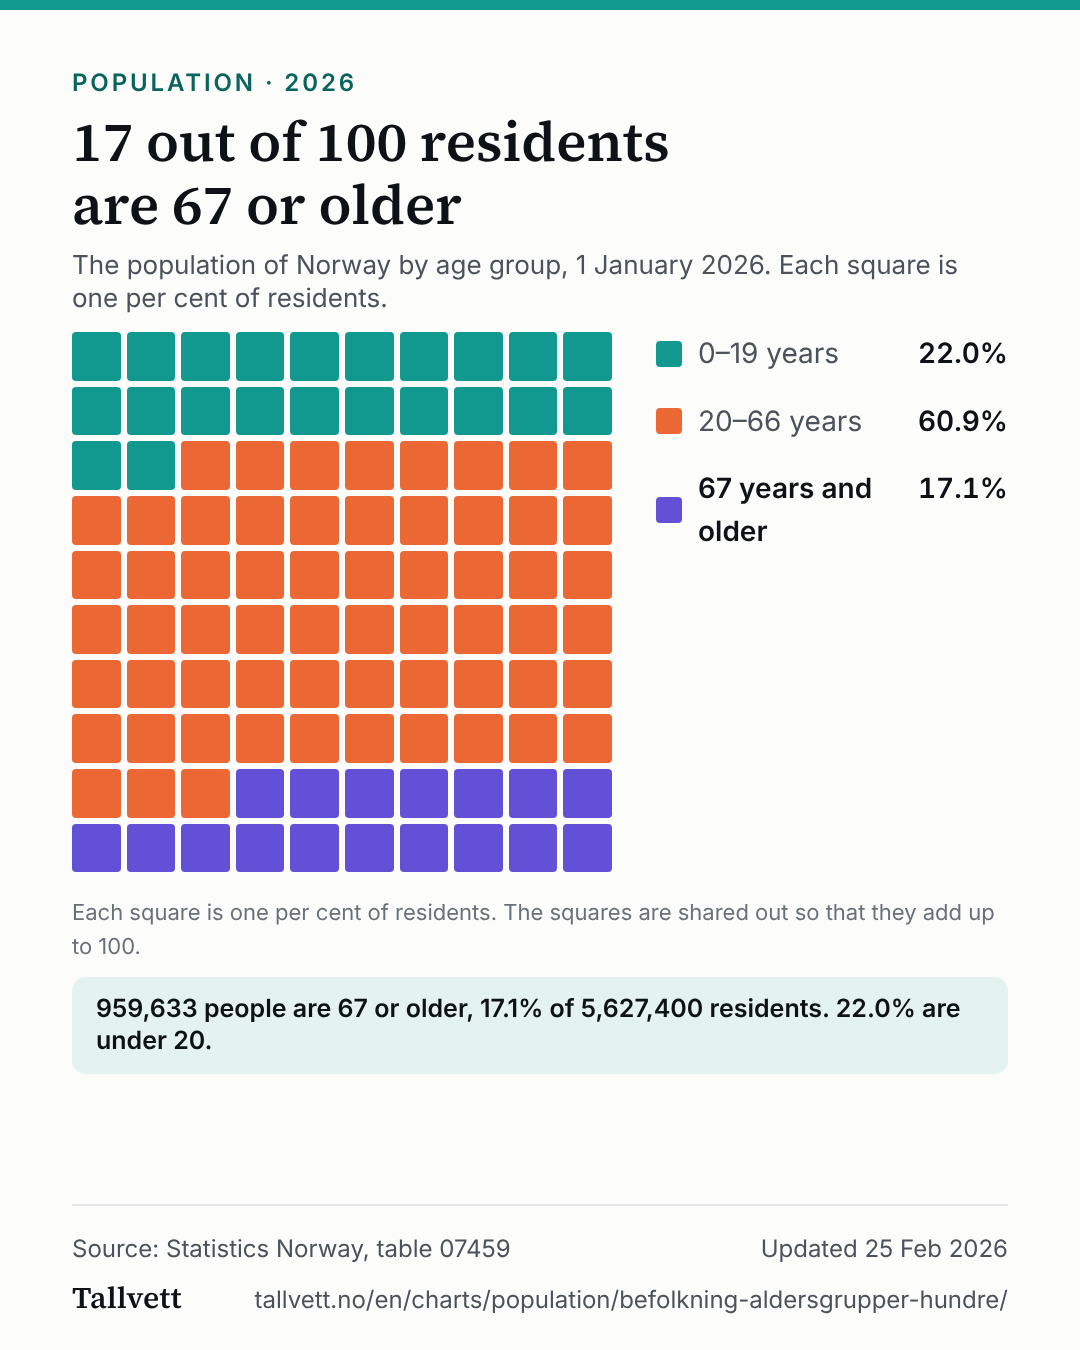 17 out of 100 residents are 67 or older
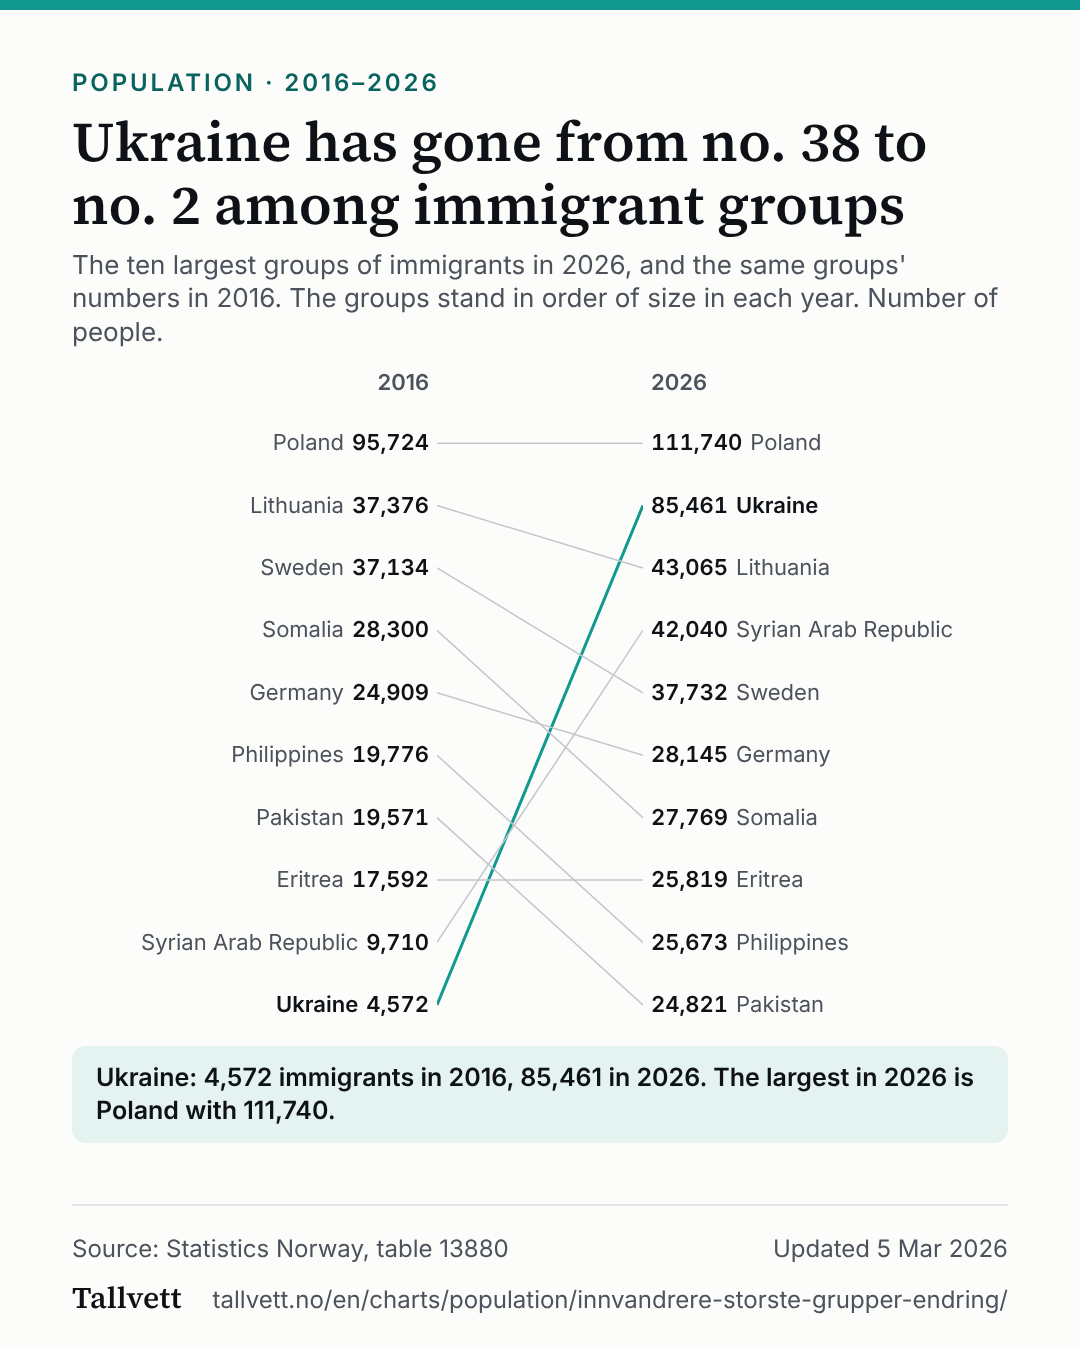 Ukraine has gone from no. 38 to no. 2 among immigrant groups
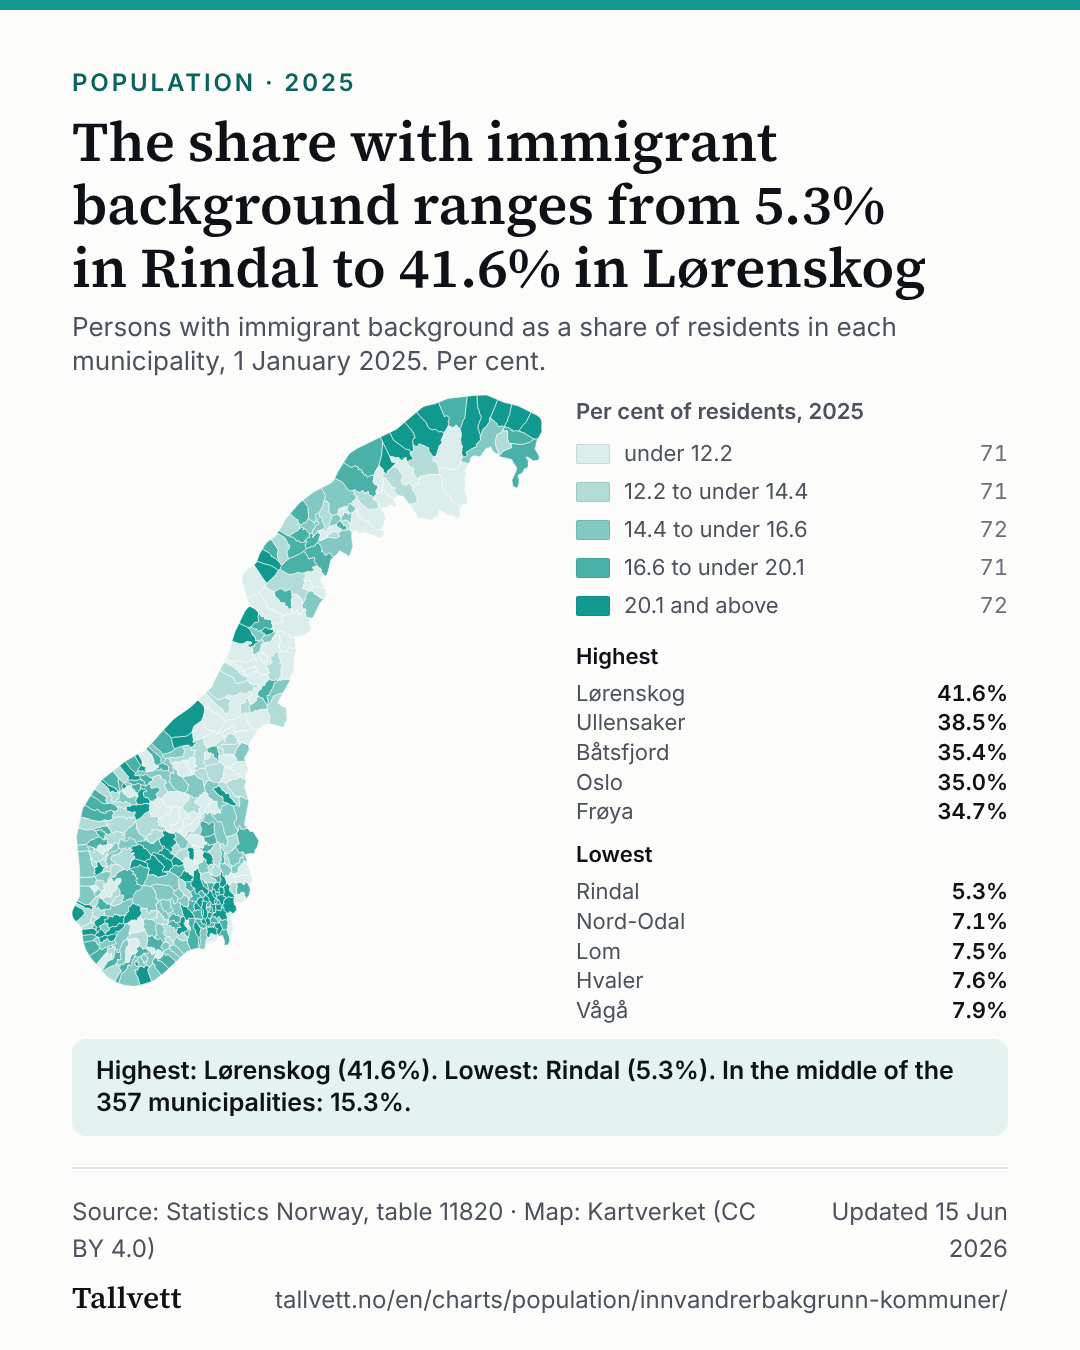 The share with immigrant background ranges from 5.3% in Rindal to 41.6% in Lørenskog
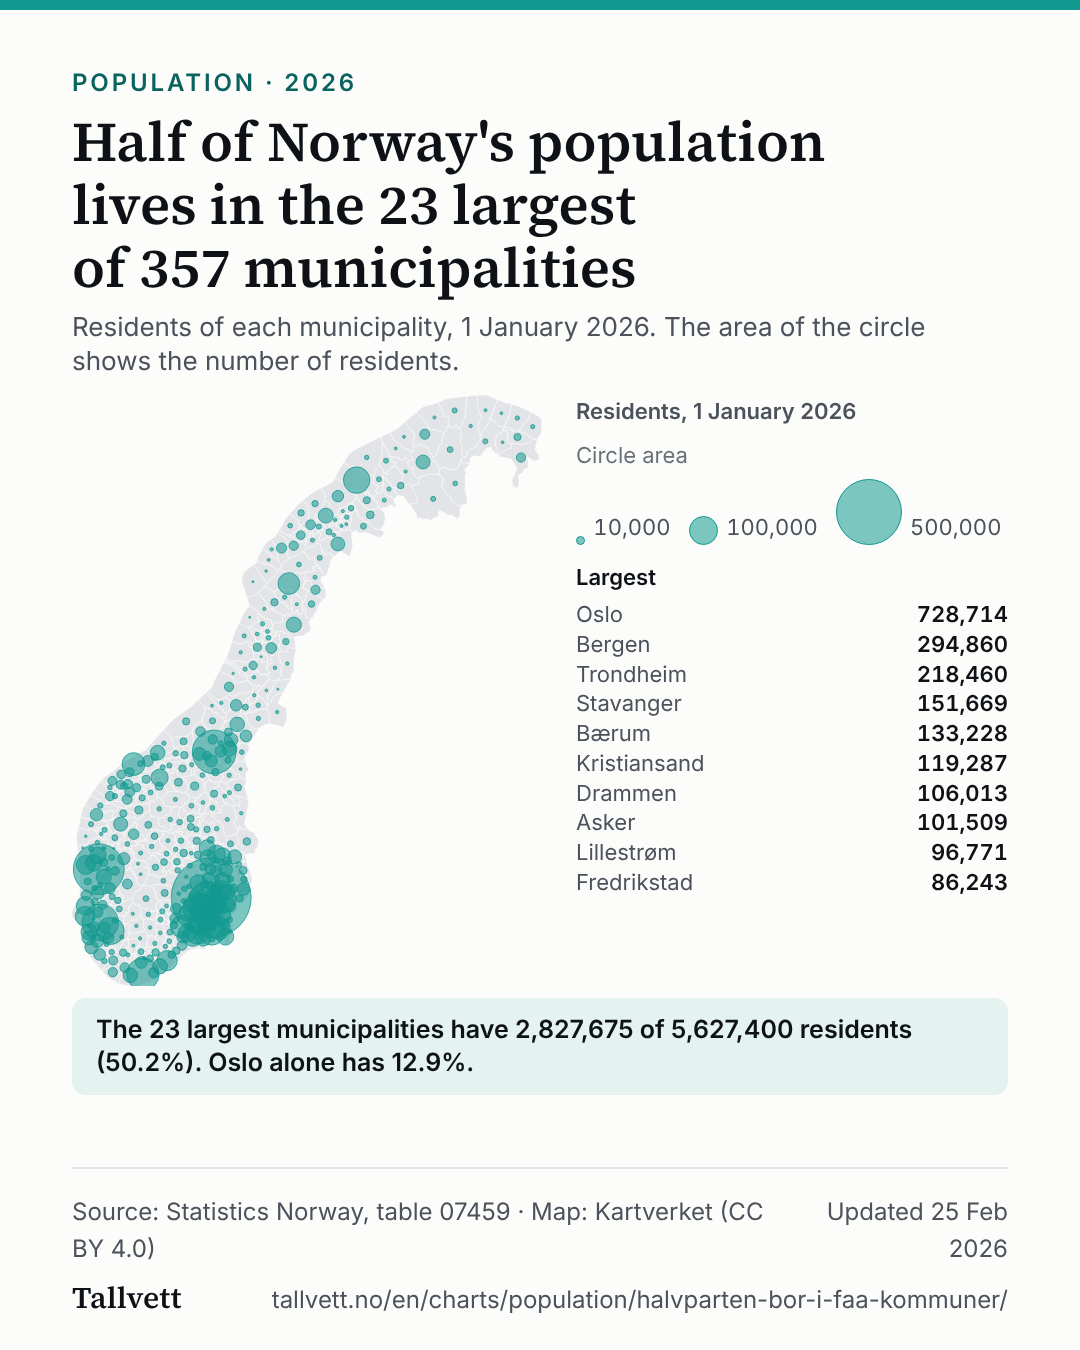 Half of Norway's population lives in the 23 largest of 357 municipalities